CFD Investigation of Thermo-hydraulic Performance in Rib Roughened Fin Under Forced Convection
Ayushman Srivastav
Shivalik College of Engineering, Dehradun, India
E-mail: ayushman.srivastav@gmail.com
Received 03 April 2022; Accepted 12 July 2022; Publication 04 March 2023
Abstract
Here, a for the purpose of investigating the thermo-hydraulic performance of, numerical simulation is performed. a fin with rib roughening and induced convection. The next paragraphs give the analysis. If we do numerical simulations under a variety of fluid flow situations and look at how they interact with one another, we might be able to obtain numerical information on the heat transfer and friction caused by a ribbed fin. We would need to examine how they interact in order to do this. There is a broad spectrum of rib pitch to rib height ratios (P/e) that are possible. it was feasible to gather data on fluid flow and temperature distribution in a validated numerical model by raising the Reynolds Number from 500 to 5000. These ratios were used to assess how effectively the model operated. To Charts that are based on the Nusselt Number and the friction factor are used in order to evaluate the thermal and hydraulic characteristics of rib-roughened fins. The findings from the rib roughened fin geometry are compared with those of a plain fin in order to determine the degree of efficiency that the test fin possesses in terms of eliminating heat from its base under operating conditions that are otherwise comparable to those previously described. This analysis was carried out to ascertain the degree of efficacy that the test fin possesses in terms of removing heat from its base. The ribbed fin’s P/e ratio of 6 contributes to the substantial increase in heat transport while also reducing friction.
Keywords: CFD, rib roughened fin, Nusselt number, friction factor, Reynolds number.
1 Introduction
It makes use of fins. to improve the rate of convective heat transfer as effectively as feasible in a wide range of technical applications. This is done by lowering the amount of main surface area needed while yet obtaining a sizable overall heat transfer surface area. Heat transmission from a fin’s base into the fluid that surrounds it is one of its functions. The huge surface area that a fin has allows for this. Fin building usually involves the use of thermally conductive materials. Construction of cooling fins typically accounts for the rate of heat transfer from a heat exchange surface. Practical considerations drive this action. This is because how quickly heat is transmitted affects how the systems are characterized in terms of their size, form, and component composition. The numerous ways that the system parameters and flow characteristics of engineering systems affect such systems’ thermal performance have been the subject of extensive investigation. Both experimental and computational approaches were used to explore the heat transfer and frictional properties of fin arrays in order to establish the best geometric parameters for a certain operating environment. This was done to find out which geometrical factors had the most effects on the arrays of fins. Due to their uncomplicated shapes the majority of applications that involve heat transfer use rectangular plate fins and pin fins because of their efficiency and the ease with which they can be manufactured.
J. C. Han and his colleagues [1] looked into the impact that the form of the ribs, the angle of attack, and the ratio of the pitch to the height of the ribs had on the friction factor and heat-transfer outcomes on the rib-roughened surface. By analyzing the form, spacing, and angle of attack of the rib structure, they were able to establish a general connection between the friction factor and the heat transfer that was induced by the rib structure. In addition, the data that they shared shown that ribs with an angle of attack of 45 degrees are superior in terms of the amount of heat that they are able to transmit for a certain amount of pumping effort. This point was driven home through the use of data analysis.
Using a computational approach, Rongguang Jia and colleagues [2] assessed the velocity and heat transfer qualities of a number of slot jets that were impinging on ribs in channels that were roughened. He came to the conclusion that the positioning of the ribs is the main element in determining how efficiently heat is carried after considering the size of the jets and the arrangement of the ribs. The diameters of the ribs and the orientation in which they are organized are two of the most crucial aspects when it comes to the process of heat transmission in rib-roughened channels. Due to the bigger recirculation zones that are formed when jets are placed close to a roughened wall, the higher heat transfer coefficients that are produced.
To ascertain the influence that thermal boundary conditions have on the precision of heat transfer estimations determined numerically from rib-roughened passageways, G. Iaccarino and his colleagues [3] conducted study. The fact that they were able to maintain a constant The distribution of heat was an important factor in the outcomes they achieved. They were able to ascertain the degree to which the expected heat transfer is affected by the boundary conditions of the numerical model. by looking at the correlations between their data and the actual observations they collected. The fact that heat was exchanged brought to light the delicate nature of the situation that was taking on. It was demonstrated that by taking into consideration conduction heat transport in the rib, some of the disparities that were found between the numerical data and the experimental data could be minimized.
The research that was conducted by P. M. Ligrani and his colleagues [4] demonstrated the friction factor, the regionally averaged Nusselt number, and the spatially resolved Nusselt number for a stationary channel that had been roughened using angled rib turbulators that were inclined at 45 degrees. According to the findings of their investigation, the top face of the rib turbulators demonstrated the highest spatially resolved local Nusselt number. In addition, it was shown that the zones of flow separation and shear layer reattachment had a substantial impact on the behavior of surface heat transfer at the local level.
It has been demonstrated that the flow characteristics of rib-roughened ducts are affected by the angle at which the ribs are positioned by Xiufang GAO and colleagues [5]. By examining how the flow altered as the angle changed, this was proven. Their research revealed that the ribs produced the strongest secondary flow when they were angled at 45 degrees, as seen by the results of their study. The study also revealed that the sort of secondary flow created, its intensity, and the mean flow velocity distribution along the direction of the spans are all influenced by the orientation of the ribs. The ability of the ribs to be orientated either horizontally or vertically served as evidence for this.
M.K. Gupta and S.C. Kaushik. [6] On the absorber plate of the solar air heater duct, a comparative research of numerous artificial roughness geometries was carried out in order to investigate the heat transfer and frictional qualities. It was chosen to carry out this research in order to get further knowledge. It was shown that circular ribs and V-shaped ribs considerably improve exergy efficiency throughout a larger range of Reynolds numbers, whereas chamfered rib-groove geometry enhances exergy efficiency at relatively low Reynolds numbers. Furthermore, it was demonstrated that circular and V-shaped ribs considerably increase the exergy efficiency at lower Reynolds numbers. numbers. The effect that gluing rectangular blocks to the surface of walls had on the rate at which heat was transmitted away from the surface was examined in experiments carried out by Bilen et al. [7]. The Reynolds number, according to them, is the single most important factor affecting how rapidly heat is transported. The findings of the observations indicate that an increase in the Reynolds number and an increase in the turning angle of the blocks have the most potential to enhance heat transfer. These are the two factors that have been identified as having this ability. This is due to the fact that these two elements have the greatest ability to encourage heat transfer.
In an effort to achieve the maximum degree of efficiency feasible, ApurbaLayek [8] modified the roughness characteristics solar air heaters, in line with the need for the effective efficiency of the device. According to him, solar air heaters with absorber plates that have chamfered rib-groove roughness display a better thermal gain than smooth collectors with practically the same pressure drop penalty. This is because these heaters have a chamfered rib-groove on either side of the plate. This is true even if the pressure drop penalty for both types of collectors is equal. This outcome will persist even if the pressure drop penalty for the two distinct types of collectors is equal. Additionally, they outperform the conventional smooth-air heaters that are already on the market in terms of their effective efficiency.
In order to calculate the quantity of heat transfer and frictional losses caused by a collection of solid and perforated fins that were put on a flat plate, Shaeri et al. [9] used numerical methods. This was carried out in order to calculate the amount of heat that was transmitted and the amount that was lost through friction. The placement of the window apertures on perforated fins is unique. The cross section of these window apertures is square. The results showed that perforated fins had much greater overall heat transfer rates than solid fins while having a significantly lower weight. In contrast to the solid fins, this According to a study, boosting the Reynolds number causes the drag ratio to decrease and perforated fins have significantly less drag than unperforated fins. These two results may both be explained by the impact that raising the drag ratio has on the drag ratio. It is typical for the proportion of enhanced heat transfer given by perforated fins compared to solid fins to decrease as the Reynolds number rises. This is so that more air can travel through the fins than solid fins can.
Iftikarahamad H. Patel and Sachin L. Borse collaborated during the experimental investigation of the forced convection heat transfer across the dimpled surface [10]. Do Seo Park [11] investigated the effects of a laminar airflow on a heat sink with dimples. This study can be compared to the present one. Both experimental and computational studies employing dimples of circular (spherical) and oval (elliptical) shapes were carried out in order to accomplish this goal. In his experiments, he showed that increasing the Reynolds number enhanced the thermal performance of circular and oval dimpled fins. It was found that the thermal efficiency of fins with oval dimples was significantly higher than that of those with circular dimples.
Anil Singh Yadav and J. L. Bhagoria created a computational fluid dynamics (CFD) model of the turbulent flow through a solar air heater that was roughened with square-sectioned transverse rib roughness [12]. Anil Singh Yadav and J. L. Bhagoria created the model. They discovered that the relative roughness height has a considerable impact on the average heat transfer, average flow friction, and thermo hydraulic performance parameter.1
Using the more conventional numerical methods, the purpose of this experiment is to analyze the heat transfer and frictional properties of a flat plate fin that has repeating ribs on its two wide sides. This will be carried out in an environment that has a significant amount of convection that is imposed onto it. A comparison is done between the effectiveness of a ribbed fin and a plain fin under the same boundary circumstances in order to evaluate the performance of the test fin in terms of heat transfer. This comparison is made while the boundary conditions remain the same. This is done so that an accurate assessment of the performance of the test fin may be made. By solving the governing equations with the boundary conditions that were supplied for a variety of ribbed fin forms, data on heat transfer and friction have been collected for a variety of fluid flow rates. These data have been acquired for a range of ribbed fin shapes. A wide range of ribbed fin shapes were used to obtain these numbers. Because of this, the creation of the data was not only possible but also feasible. When compared to those of a plain fin, the benefits that various ribbed fin characteristics bring about in terms of heat transfer and friction are noted to be more meaningful under a variety of fluid flow Reynolds numbers. This is the case regardless of the fluid flow Reynolds number. The comparison will take place against the backdrop of a plain fin.
2 Problem Description and Computational Domain
The suggestions of Franke’s [13] were used as a guideline for selecting the computational domain for an evaluation. A test fin that has been mounted to the base plate, which is regarded as an isothermal surface, is shown in Figure 1 as an illustration. The airflow is thought to be constant when temperature-dependent thermophysical factors are taken into account. The forced convection of heat between the air surrounding the ribbed fin and the surroundings is made possible by the existence of a wide range of air velocities, changing the laminar flow pattern to turbulent. The fins are made of aluminum since it is not only lighter but also has a greater conductivity. The height of the test fin (hf) and its thickness (D) are determined to be 48 millimeters and 4 millimeters, respectively, in order to calculate the length (L) of the test fin.
In that order, the planes “abcd,” “ijkl,” and “bckj” stand in for, respectively, the top free stream surface, the exit section of the computing domain, and the entry portion of the computing domain. The entry and departure zones on the downstream and upstream sides of the fin are each 5 hf long, whereas the upstream side of the fin’s zones are 10 hf long. The domain is measured at 6 hertz in the Y direction and 4 hertz in the Z direction when the fin is not present. The inlet velocity components are specified as uin u, vin win, 0 and Tin T in order to account for the occurrence of uniform flow conditions at the inlet section “abcd”. Vin is equivalent to Tin, uin is equivalent to 0, and win is uin. A “bckj” cannot be planned unless the stream conditions are free stream. The temperature and pressure are able to maintain their stability because of the necessary distance between the exit plane (ijkl) and the plate (efgh).
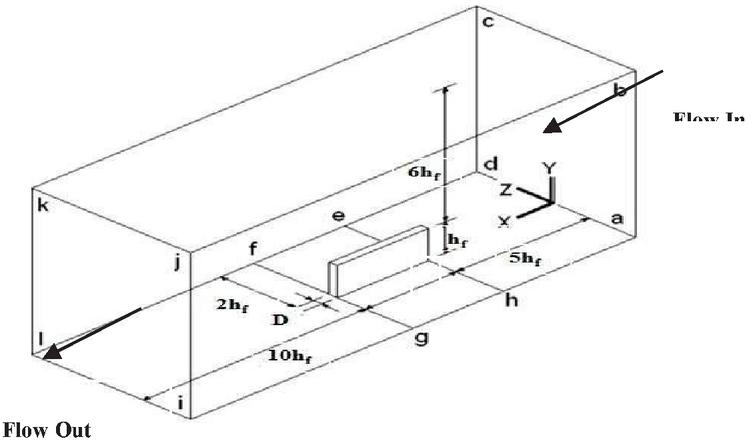
Figure 1 Computational domain.
The pressure gradients must run parallel to X, as may be inferred. Since there are no slip conditions at the surfaces of the remaining planes, they are thought of as adiabatic walls made of solid material. The fluid in the free stream is supposed to have a temperature of 25 degrees Celsius, whereas the temperature of the fin base plane “efgh” (Tb) is thought to be maintained at a constant level of 70 degrees Celsius.
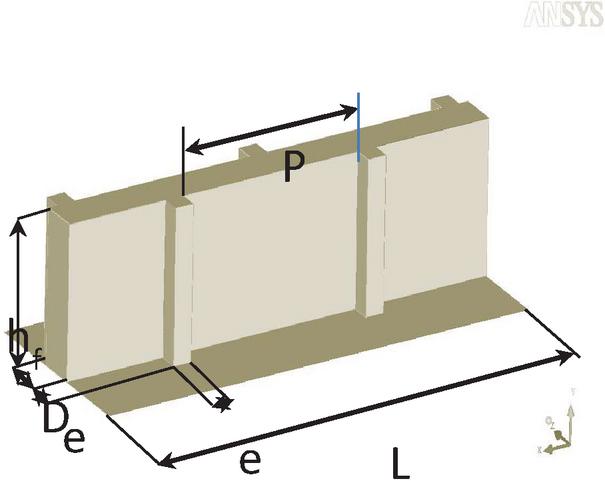
Figure 2 Ribbed fin geometry.
Leung and Probert [14] discovered that for polished aluminum fins, the thermal radiation rate is less than 8% of the overall heat transfer rate from the finned surfaces. This is true as long as the temperature differential is always limited at no more than 77.5 degrees Celsius. Because the largest temperature difference recorded throughout the research was 45 degrees Celsius, the influence of radiation heat transfer is not taken into consideration in the work that is being given here, in keeping with the preceding finding. This is because a radiation heat transfer caused the largest temperature difference that could be observed. The solid fin will eventually have square ribs added to each of its sides. These ribs will be pitched in line with the requirements and will extend the whole length of the fin. Figure 2 is a depiction of the geometrical features of the ribbed fin, and it may be seen here. The pitch of the sail is the separation between the ribs of height (e), which are oriented in the direction normal to the flow (P). The relative rib pitch is computed by dividing the rib pitch by the rib height and is represented by the symbol “P/e”. Table 1 displays the findings of the grid independence investigation for a fundamental fin. It is obvious that the values of the Nusselt have seen large variations. This is as a result of the altered grid pattern and increased number making friction issues more noticeable. It was discovered that the change in the values of the Nusselt number and the friction factor was less than 0.83% and 1.40%, respectively, after moving beyond the grid sizes of 1643511 for the fin and 679223130 for the entire domain. Even after accounting for the impacts of the grid size, this remained the case. The same might be stated for both variables.
Table 1 Grid independency test for a plain fin (Re 5000)
| Grids in Whole | Grids in Plain | Nusselt | Friction |
| Domain (X Y Z) | Fin (X Y Z) | Numbr (Nu) | Factor (f) |
| 228 84 52 | 48 12 4 | 14.48 | 0.00351 |
| 353 94 65 | 54 14 5 | 16.23 | 0.00491 |
| 425 112 78 | 64 17 6 | 17.69 | 0.00544 |
| 527 155 86 | 110 21 8 | 18.77 | 0.00563 |
| 632 186 103 | 120 25 9 | 20.28 | 0.00598 |
| 679 223 130 | 164 35 11 | 20.45 | 0.00606 |
3 Numerical Method
3.1 RNG k- Turbulent Model
The RNG k-epsilon (k-) model is used in this study to simulate the turbulent flow in order to supplement the presumptions that the flow is incompressible with constant thermal conductivity, no heat loss, no compression effort, and no heat generation. In order to support the assumptions, this model simulates the turbulent flow. This is done in order to provide greater evidence for the assumptions that the flow is incompressible and has a constant thermal conductivity. Given that it is assumed that the turbulence would be homogeneous and isotropic, the following two equations include the data needed to calculate the kinetic energy and rate of dissipation of the turbulence:
| (1) |
The equation for the rate of turbulent energy dissipation is
| (2) |
Given that S is the mean rate-of-strain tensor’s modulus, written as S (2Sij Sij), where Gk denotes the production of turbulent kinetic energy as a result of mean velocity gradients and Sij may be expressed as Given that S is the modulus of the mean rate-of-strain tensor, denoted as S (2Sij Sij), and given that S
| (3) |
By adding k and, the turbulent (or eddy) viscosity t is calculated as follows:
| (4) |
The values of the model constants for the two transport equations C1 and C2 are as follows: C1 1.42; C 2 1.68; C 0.085; k 1.0; 1.3.
3.2 Solution Method
FLUENT By combining the second order upwind method used for the energy and momentum equations with the SIMPLE pressure-velocity coupling approach, the incompressible RANS equations can be solved. The final number is 14.0.
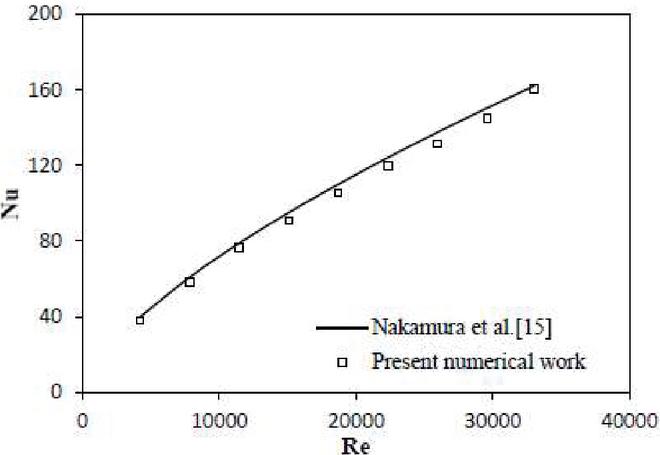
Figure 3 Comparison of numerically predicted Nusselt number and the experimental Nusselt number [15].
4 Validation
The findings of the computational model are compared with the experimental data that was provided by Nakamura et al. [15] in order to validate the present numerical approach that is being used. To improve the effectiveness of the numerical technique, this step was taken. The research conducted by Nakamura et al. experimental. focused on the fluid flow and local heat transfer that occurred in the vicinity of the cube that was mounted on the wall of the airplane [15]. The Reynolds values that were considered fell somewhere in the range of 4,200 to 33,000. According to what they said, the following is how the link between the Reynolds number and the mean value of the Nusselt number should be understood:
number:
| (5) |
The mean Nusselt number for a cube attached to the wall and subjected to a range of Reynolds numbers was determined using the equation Nu m 0.137 Re 0.68. The mean Nusselt number for the cube was calculated using this equation. To make it easier to compare the data on heat transfer that were acquired using the current numerical technique with the data that were obtained using the correlations that were proposed by Nakamura et al. [15], the values of the Nusselt number are provided here as a function of the Reynolds number. This was done in order to compare and contrast the two separate sets of data. The comparison graphic in Figure 3 shows how closely the most recent numerical data and related data obtained from correlations correlate with one another. This may be observed simply contrasting the two sets of data. The present numerical data are discovered to have an average absolute departure from the correlation data of 3.7%, which is discovered to be within the allowable boundaries for such a divergence. Numerous causes, including variations in the turbulent flow’s strength, changes in the inlet boundary layer, numerical discretization, meshing error, or any combination of these four elements, might have an impact on the seemingly tiny divergence.
5 Results and Discussion
In order to acquire the statistics that are relevant to heat transfer and friction from a ribbed fin when it is subjected to forced convection, the tried-and-true numerical approach is applied. This strategy has been implemented for quite some time. In order to analyze the heat transfer and friction properties of ribbed fins, it is required to create heat transfer factor charts, Nusselt factor charts, and friction factor charts. Due to the fact that each chart displays a unique collection of operational and system information, it is imperative that all three charts be utilized. When the current is Reynolds numbers are increased from 500 to 5000, the heat transfer performance of ribbed fins is also assessed using the Nusselt number enhancement ratio (Nur/Nup) and thermo hydraulic performance () for different fin shapes. When the flow Reynolds numbers are modified, both of these measurements are applied. It is obvious that the kind of fluid flow in the boundary layer greatly affects the quantity of heat that is transferred from a fin when forced convection is present. Even in the absence of induced convection, this is the case. Because forced convection is a kind of natural convection, this is the case. It has been determined that a significant increase in fluid flow velocity causes a discernible rise in the rate at which the fin may release heat energy into the environment.
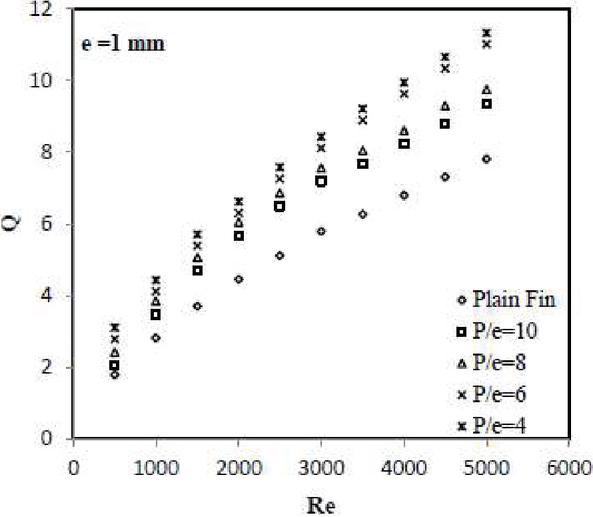
Figure 4 Variation of fin heat transfer rate with Reynolds number for different relative rib pitch (P/e) at e 1 mm.
It is believed that adding turbulators in the shape of ribs or any other surface irregularity, such as grooves or holes, will disturb the area near to the wall and increase heat transfer rates in exchange for a bigger drop in pressure. Even if the pressure would drop further, this would still be the case. For a range of rib pitch to rib height ratio values that equate to a rib height of 1 millimeter, the fin heat transfer rate is shown in Figure 4 as a function of flow Reynolds number. For a single rib with a height of 1 millimeter, this relationship is displayed. It is plainly obvious that the values of the heat transfer rate are proven to climb in lockstep with the Reynolds number when the value is increased, regardless of the particulars of the case. The figures shown in the image show that a ribbed fin generates heat transfer rates that are much greater than those of a simple fin. The faster heat transfer rates of the fin are ultimately caused by the larger overall surface area of the fin in combination with the vortices that are created by the square ribs. As the relative rib pitch (P/e) lowers, the rate of heat transfer rises in a direct and proportionate manner.
Figure 5 shows how the amount of heat transmitted from the ribbed fin surface depends on the relative rib pitch (P/e). The graphic makes this clear. The highest heat transfer corresponds to the relative rib pitch (P/e) of 4, which causes a substantial improvement in heat transmission compared to the plain fin at all levels of Reynolds number. This is due to the fact that an increase in the Reynolds number will enhance heat transfer proportionally. This is because an increase in the Reynolds number causes the quantity of heat that may be conveyed to rise proportionally. In Figure 6, the Nusselt number fluctuation is shown next to the simple fin to serve as a point of comparison. This is required since the Reynolds number varies from 500 to 5,000 depending on the relative rib pitch (P/e) value.
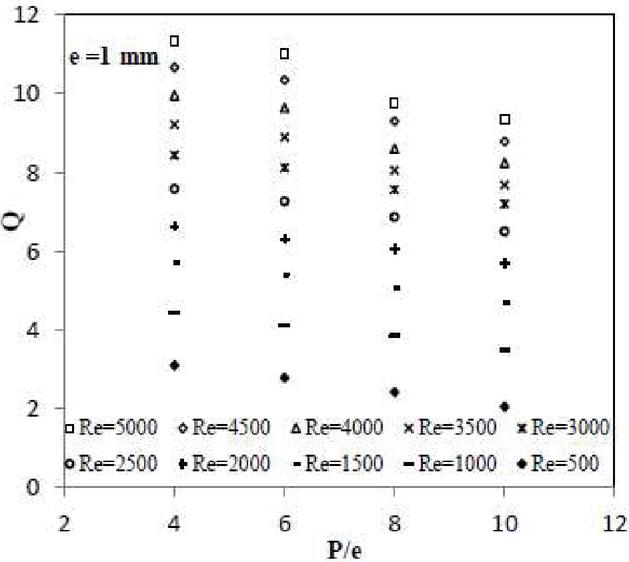
Figure 5 Variation of fin heat transfer rate with Relative Rib Pitch (P/e) for different Reynolds number at e 1 mm.
All of the cases, with the exception of the basic fin, exhibit a considerable increase in the values of the Nusselt number. To help readers understand how the Nusselt Number moves in response to changes in the relative rib pitch (P/e), Figure 7 is provided. The Nusselt number has been shown to grow in step with the relative rib pitch up to a point of 6, after which it starts to decline in step with further increases in the relative rib pitch. For each of the several values that the Reynolds number may have, this phenomenon is seen.
The repeated ribs on the surface are hypothesized to create flow separations and reattachments, which ultimately results in a major alteration in the local heat transfer rates. The place where the boundary layer rises at the rate that is the quickest before the next rib is reached, according to previous research, is the one that is positioned near to the site of reattachment. It follows that the maximum value of the Nusselt number was probably found at a certain relative rib pitch value. Investigating this is a worthwhile endeavor.
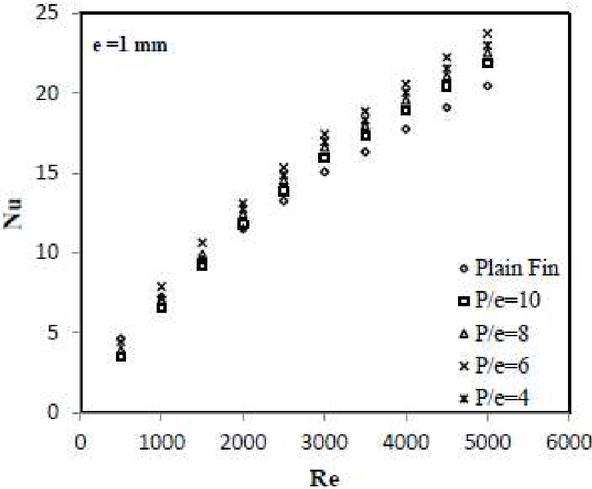
Figure 6 Variation of fin Nusselt number with Reynolds number for different relative rib pitch (P/e) at e 1 mm.
To help the reader better understand the properties of the ribbed fin that are connected to the transport of heat, temperature contours with a relative rib pitch of 6 are provided in Figures 8 and 9. The fact that the surface temperature of the ribbed fins reduces significantly as one approaches the aircraft’s leading end shouldn’t be all that surprising. The reason for this is that when the stream of cold air approaches the leading edge of the fin, it detects a wider temperature differential, which causes it to perceive a greater rate of heat transfer. When temperature contours are carefully examined, it is clear that, aside from the leading edge of the fin, the region with the lowest temperatures may be located in the center of the area represented by the two ribs. Despite the fact that the leading edge of the fin has the lowest temperature, this is the case. The vortices that are created by the roughness of the ribs also provide a localized contribution to the removal of heat. The temperature is brought down as part of this contribution. This may be explained by the flow reattaching to the fin’s surface, which causes the heat transfer between the two ribs to happen more quickly. Figure 10 shows how flow affects various relative rib pitches (P/e), which may be found in a variety of different combinations. What impact does the Reynolds number have on how the friction factor is calculated? The graph gives a visual representation of how the friction factor decreases as the flow rate rises. All fin designs see an increase in Reynolds number as the viscous sublayer thins out as the Reynolds number increases. The Reynolds number approaches greater levels when this occurrence occurs.
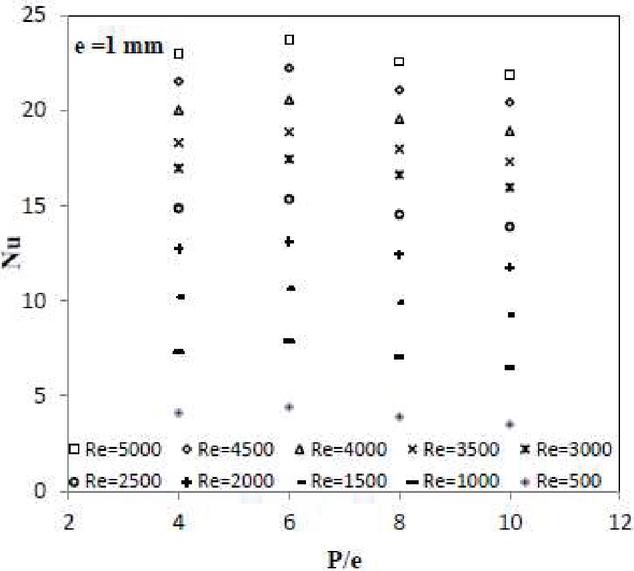
Figure 7 Variation of fin Nusselt Number with Relative Rib Pitch (P/e) for different Reynolds number at e 1 mm.
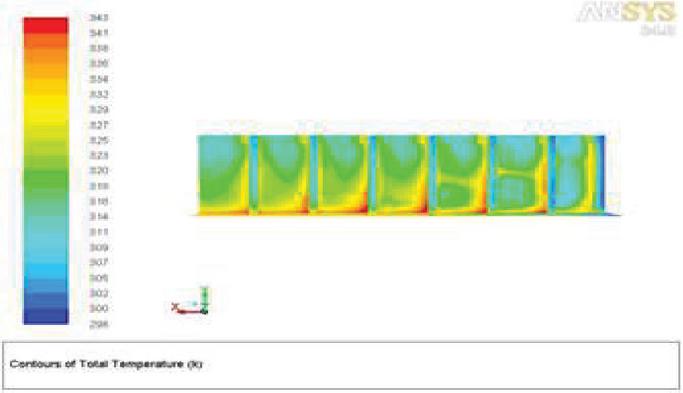
Figure 8 Front view of a ribbed fin showing temperature contours. (e 1 mm; P/e 6; Re 5000).

Figure 9 Top view of a ribbed fin showing temperature contours. (e 1 mm; P/e 6; Re 5000).
It is plain to see that the shape of the ribs has been vastly enhanced. as a result of the addition of rib roughness, and this improvement may be linked to the addition of ribs. Transversely oriented square rib structure is a distinguishing feature of this form of construction. A ribbed fin exhibits a noticeable increase in friction factor when used in settings that are otherwise the same as a regular fin. This idea is amply illustrated by the comparison.
When the distance between the ribs is held constant at 1 mm, Figure 10 illustrates how the friction factor of the fin varies with the Reynolds number for different relative rib pitches (P/e), as long as the space between the ribs is kept the same. Figure 11 shows the simple fin’s velocity curve at a value of 5000.
Figure 12 depicts the velocity curve of a fin with ribs, with e equal to 1 millimeter, P/e equal to 6, and re equal to 5000.
In contrast, the flow can be seen to separate at the rib in Figures 11 and 12, where it then seems to reunite with the surface close to the adjacent rib. In these images, the flow patterns over a simple fin are contrasted with those over a ribbed fin profile. The creation of a dead zone, which therefore prevents heat from moving through this region, is caused by the split boundary layer that is situated behind the rib. By creating a vortex close to the rib, which in turn creates the zone, this is done. A picture of the vector contour is shown in Figure 13. It demonstrates how the stream’s flow direction clearly reveals the expansion of the dead zone and how the contour is reattached around the location of the next rib.

Figure 13 Velocity vector contour showing the direction of flow (e 1 mm; P/e 6; Re 5000).
Figure 14 illustrates how the Reynolds number affects the Nusselt number enhancement ratio ((Nu r)/Nu p) for a variety of relative rib pitch (P/e) values that correspond to a rib height (e) of one millimeter. This picture also illustrates the effect that the Reynolds number has on the enhancement ratio calculated from the Nusselt number. It is possible to show that the ribbed fin with a relative rib pitch (P/e) of 6 performs better than the other morphologies of fins in terms of overall performance. When computed at a rib height of 1 millimeter, Figure 15 depicts the change in the friction factor ratio (f r/f p) that occurs for different values of the relative rib pitch. This was done using the same formula. (e). When compared to lesser values of (P/e), the friction factor ratio curve has its steepest slope when (P/e) is more than 10. This is due to the fact that although the friction factor ratio drops with increasing Reynolds number, the slope of the friction factor ratio curve increases with increasing Reynolds number. This is the case due to the fact that a rise in the Reynolds number results in a decrease in the friction factor ratio. As a consequence of this, the thermal and hydraulic performance of the system needs to be taken into consideration before deciding whether or not to implement any particular enhancement idea. To conduct an evaluation of this kind, a technique that was devised by Webb and Eckert [16] is now commonly used. This technology, which may be characterized as a thermo-hydraulic performance metric, is now put into practice on a large scale.
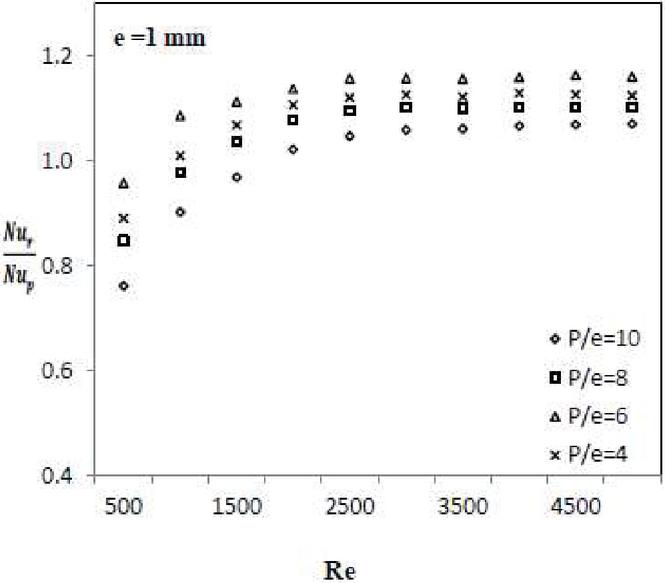
Figure 14 Variation of Nusselt number enhancement ratio with Reynolds number for ribbed fin at e 1 mm.
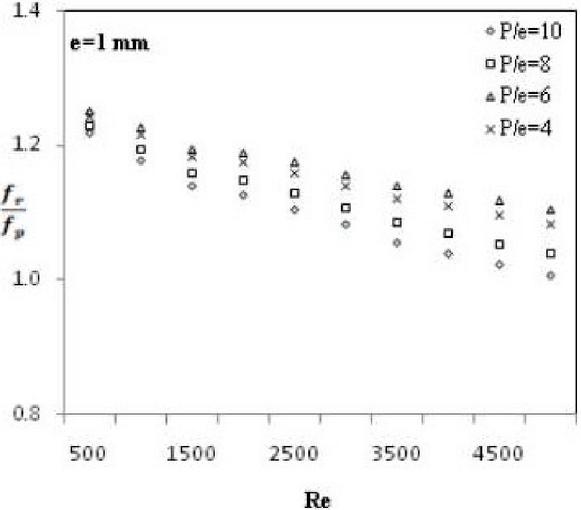
Figure 15 Variation of Friction factor ratio with Reynolds number for ribbed fin at e 1 mm.
The Nusselt number ratio of a roughened surface to a smooth surface when both surfaces have the same amount of pumping power is known as the thermo-hydraulic performance parameter.
| (6) |
Figure 16 demonstrates how, when the rib height is equal to 1 mm, the thermo-hydraulic performance of the roughened rib fin improves as the Reynolds number rises [17–21]. The fact that the Reynolds number rises serves as an example of this. This is the scenario that takes place under the circumstances shown in the graphic. For all various Reynolds number values, it has been demonstrated that the relative rib pitch (P/e) of 6 yields the optimum thermo-hydraulic performance.
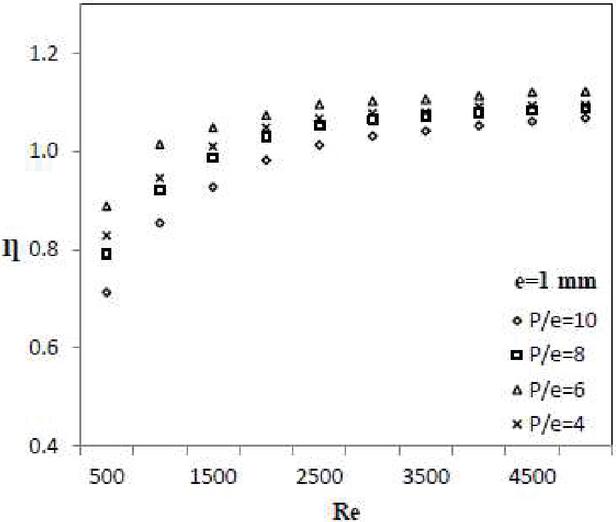
Figure 16 Thermo-hydraulic performance as function of Reynolds number for ribbed fin at e 1 mm.
6 Conclusions
In the current work, a computer method is utilized to analyze the heat conduction and frictional properties of a ribbed fin. For the purpose of this review, a ribbed fin will be employed. The following are a few possible inferences that one may make based on the results of the study.
Even though it causes an increase in frictional losses, the ribbed fin is able to vastly improve the rate at which heat is transported in comparison to a conventional fin. This is the case despite the fact that it results in a greater overall surface area. A relative rib pitch (P/e) of 6 exhibited an improvement in heat transfer that was almost twice as effective as the performance of the plain fins. This was the case when compared to the performance of the plain fins.
Both the Nusselt number and the Reynolds number go up whenever the Reynolds number goes up, while the friction factor goes down as the Reynolds number goes up. It doesn’t matter what the circumstances are, this is always the case. When the relative rib pitch, also known as P/e, is increased to a value of 6, the Nusselt number and the friction factor are both increased to the maximum values that are feasible for each of those variables.
The largest value that can be attained for the thermo-hydraulic performance parameter of the rib-roughened fin corresponds to a rib pitch of 6, which was demonstrated to be the optimal value. This is the case since this value can be achieved.
Nomenclature
| Ab | Cross-section area of the base plate |
| Af | Cross-section area of the fin |
| Cp | Specific heat |
| Cp, Al | Specific heat of aluminium |
| D | Fin thickness |
| Dh | Equivalent hydraulic diameter of duct |
| e | Height of the rib |
| f | Friction factor |
| h | Convective heat-transfer coefficient |
| hf | Fin height |
| hp | Height of perforation |
| kA1 | Thermal conductivity of aluminium |
| k | Turbulent kinetic energy |
| Pr | Prandtl number |
| Q | Heat transfer rate to air |
| R | Residual |
| Re | Reynolds number |
| t | Time |
| T | Temperature |
| Tin | T Mean plate temperature |
| Wp | Width of perforation |
| uin u | Inlet velocity of air |
| X, Y, Z | Rectangular coordinate |
| P/e | Relative rib pitch Greek symbols |
| Under-relaxation factor | |
| Difference | |
| Dynamic viscosity | |
| Density of air at bulk mean air temperature | |
| General variable | |
| The vector differential operator | |
| Turbulent dissipation rate | |
| Thermo hydraulic performance |
References
[1] Han J.C., Glicksmanan L.R. and Rohsenow W.M. “An investigation of heat transfer and friction for rib-roughened surfaces”, Int. J. Heat & Mass Transfer, Vol. 21; pp. 1143–1156.
[2] Rongguang Jia, Masoud Rokni and Bengt Sundeń “Impingement cooling in a rib-roughened channel withcross-flow”, International Journal of Numerical Methods for Heat & Fluid Flow, Vol. 11; No. 7, pp. 642–662 (2001).
[3] Iaccarino G., Ooi A. and Durbin P.A., Behnia M. “Conjugate heat transfer predictions in two-dimensional ribbed passages”, International Journal of Heat and Fluid Flow, Vol. 23; pp. 340–345 (2002).
[4] Ligrani P.M. and Mahmood G.I. “Spatially Resolved Heat Transfer and Friction Factors in a Rectangular Channel With 45-Deg Angled Crossed-Rib Turbulators”, ASME, Vol. 125; Issue July, pp. 575–584 (2003).
[5] Xiufang Gao and Bengt Sundeń, “Effects of Inclination Angle of Ribs on the Flow Behavior in Rectangular Ducts”, ASME Vol. 126; Issue July, pp. 692–699 (2004).
[6] Gupta M.K. and Kaushik S.C. “Performance evaluation of solar air heater for various artificial roughness geometries based on energy, effective and exergy efficiencies”, Renewable Energy, Vol. 34; pp. 465–476 (2009).
[7] Bilen K., Yapici S. and Celik C., “A Taguchi approach for investigation of heat transfer from a surface equipped with rectangular blocks”, Energy Convers Manage, Vol. 42; pp. 951–961, (2001).
[8] LayekApurba. “Optimal thermo-hydraulic performance of solar air heater having chamfered rib-groove roughness on absorber plate”, IJEE, Vol. 1; Issue 4, pp. 683–696. (2010).
[9] Shaeri, M.R., Yaghoubi, M., “Heat transfer analysis of lateral ribbed fin heat sinks”, Applied Energy, Vol. 86; pp. 2019–2029, (2009).
[10] Patel I.H. and BorseSachin, L. “Experimental investigation of heat transfer enhancement over the dimpled surface”, IJEST, Vol. 4; Issue 08, August pp. 3666–3672 (2012).
[11] Seo P.D. “Experimental and numerical study of laminar forced convection heat transfer for a dimpled heat sink”, A Thesis Submitted to the Office of Graduate Studies of Texas A&M University (2007).
[12] Yadav Anil Singh and Bhagoria J.L. “Modeling and Simulation of turbulent flows through a solar air heater having square-sectioned transverse rib roughness on the absorber plate”, The Scientific World Journal Volume, Article ID 827131 (2013).
[13] Jörg Franke, Antti Hellsten, HeinkeSchlünzen, and Bertrand Carissimo “Best practice guideline for the CFD simulation of flows” COST Action 732, (2007).
[14] Leung C.W, Probert S.D., “Heat exchanger performance: effect of orientation”, Appl Energy, Vol. 55; pp. 33–35, (1989).
[15] Nakamura H., Igarashi T. and Tasutsui T., “Local heat transfer around wall-mounted cube in the turbulent boundary layer” Int. J. Heat & Mass Transfer, Vol. 44; pp. 3385–3395 (2001).
[16] Webb R.L., and Eckert R.G, “Application of rough surfaces to heat exchanger design,” International Journal of Heat and Mass Transfer, Vol. 15, Issue 9, pp. 1647–1658, 1972.
[17] Panwar, K., Murthy, D. S. “Analysis of thermal characteristics of the ball packed thermal regenerator”, Procedia Engineering, 127, 1118–1125.
[18] Panwar, K., Murthy, D. S. “Design and evaluation of pebble bed regenerator with small particles” Materials Today, Proceeding, 3(10), 3784–3791.
[19] Bisht, N., Gope, P. C., Panwar, K. “Influence of crack offset distance on the interaction of multiple cracks on the same side in a rectangular plate”, Frattura ed IntegritàStrutturale” 9(32), 1–12.
[20] Panwar, K, Kesarwani, A, “Unsteady CFD Analysis of Regenerator”, International Journal of Scientific & Engineering Research, 7(12), 277–280.
[21] Singh, I., Bajpai, P. K., and Panwar, K. “Advances in Materials Engineering and Manufacturing Processes.
Footnotes
1Ayushman Srivastav is Assistant professor at Department of mechanical Shivalik College of Engineering Dehradun, India, PH-+91-9410593973. E-mail: Ayushman.srivastav@gmail.com
Biography

Ayushman Srivastav is currently working as Research fellow at UPES University, prior to his appointment at UPES he has served Academia for 10 years as assistant professor at Shivalik College of Engineering and DIT University. He has also worked with corporates like Samsung India Pvt Ltd and Voltas Ltd (A Tata Group Company) for initial eight years of his career. With total eighteen years of experience at the background Mr. Srivastav has obtained his masters in Thermal Engineering from Uttarakhand Technical University and received his undergraduate degree in Mechanical Engineering from University Institute of Engineering & Technology (UIET) Kanpur. His areas of Interests include thermal analysis of heat transferring surfaces.
Journal of Graphic Era University, Vol. 11_1, 1–24.
doi: 10.13052/jgeu0975-1416.1111
© 2023 River Publishers