Drill Hole Optimization for Augmenting Structural Integrity
Neeraj Bisht*, Suvam Gairola, Shivam Shekhawat, Deep Darshan and Nitesh Aithani
Department of Mechanical Engineering, GB Pant University of Agri. & Tech., Pantnagar, PIN – 263145, India
E-mail: neerajbisht30@gmail.com
*Corresponding Author
Received 04 November 2021; Accepted 12 December 2021; Publication 04 March 2023
Abstract
Structures develop cracks during the course of there life resulting in catastrophic failures. This can be reduced by drilling holes near the crack tip. Here the aspect of optimal position and size of the drill hole has been analysed. Additionally the effect of supplementary hole has also been made. Finite element code ANSYS was used for the analysis. To verify the fracture capabilities of ANSYS the results were corroborated using photoelastic techniques. It was observed that reduction in stress intensity factor to a great extent depends upon the position of the stop hole. Also it was observed that as the radius of the crack was increased the stress intensity factor increased. Creating supplementary hole further reduced the stress intensity factor. So it can be concluded that for employing the concept of drill hole its position and size should be accurately determined.
Keywords: Stress intensity factor, photoelasticity, finite element method, drill hole, optimization.
1 Introduction
Development of cracks in a structure during its service period has resulted in catastrophic failures. To prevent these failures these parts have to be replaced. This, however is impractical at times as the cost and time of replacement may be too high. Various methods have been proposed to counter this [1], filling of cracks [2–4], repair by welding [5-7]. Another successful technique to impede the effect of crack is drilling holes near the crack tip. Holes can be drilled at the crack tip reducing singularity or at some distance from the crack tip thereby deflecting the crack propagation [8–10]. It has also been seen that stress intensity factor reduction becomes more pronounced under mode II loading [11]. Keeping in view the above findings an analysis of proper position and size of the hole has been analysed. Also, to observe the effect of mixed mode loading supplementary hole has been drilled near the first drilled hole and its position has been varied. The effect of size of there hole has also been studied at the optimized position of the first drill hole. The analysis has been made using ANSYS Parametric Design Language (APDL). To verify the accuracy of APDL and to arrive at the optimized meshing photoelastic technique has been used [12]. The photoelastic technique has been used by many researchers to solve fracture mechanics problems [13–15]. To obtain the stress intensity factor a program was written in FREEMAT and an over deterministic [14] approach was used to have higher accuracy in the results.
2 Experimental Procedure
The techniques used for the analysis of the problem are described below.
2.1 Photoelastic Experiment
Photo elastic technique depends upon the ability of certain materials to become optically anisotropic when under load. The most important parameter worth considering while selecting the photoelastic material is the material fringe value. In this case epoxy resin (Araldite) has been used for the analysis. The method as discussed in reference [16–18] has been used to prepare the material and specimens.
2.1.1 Material fringe value
The material fringe value has been determined using the diametral compression technique. For this a circular disc of 60 mm diameter was prepared and examined under a circular polariscope. Figure 1 shows the fringes produced.
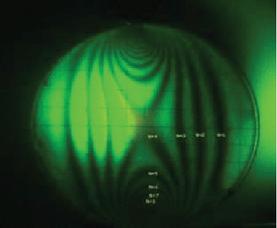
Figure 1 Disc under diametral compression.
The material fringe value was calculated as follows:
| (1) |
2.1.2 Specimen geometry
The specimen of size 100 mm 50 mm 10 mm were prepared from epoxy. Slits of length 14 mm were cut using hag saw blade, further pre-cracking upto 16 mm was done using razor blade. Loads of 711 N was applied in uniaxial tension as shown in Figure 2.
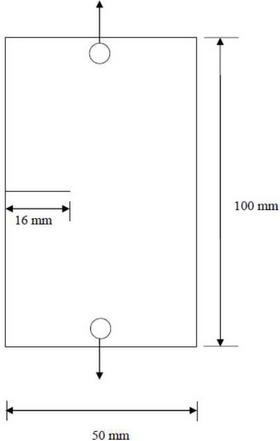
Figure 2 Specimen geometry for photoleastic experiment (load applied 711 N).
The fringes obtained under 711 N load are shown in Figure 3.
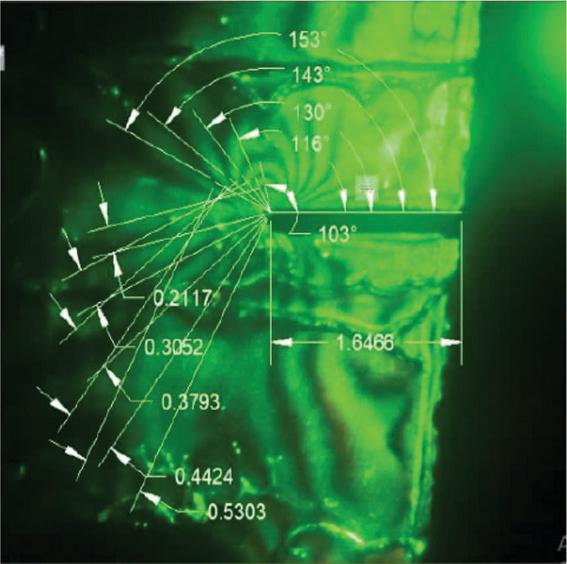
Figure 3 Model in the polariscope.
The pictures were imported into the CAD software and various points were considered and parameters related to them were evaluated.
2.1.3 Determination of stress field parameters
The stress optic law relates the fringe order N and principal stresses and as [14].
| (2) |
where h specimen thickness, N fringe order, fringe value.
For the purpose of study, the stresses in the local neighbourhood of a crack tip can be approximated by [14].
| (3) | ||
where r and are the polar coordinates with the origin defined at the crack tip. The maximum in-plane shear stress is related to the Cartesian components of stress as:
| (6) |
Substituting Equations (3)–(5) into Equation (2) gives the relationship which defines the isochromatic fringe pattern in the local field near the crack tip as:
| (7) |
Equation (7) yields the relationship between fringe order N and stress intensity factor K and K.
2.1.4 Solution of the N-K relationship
In the present thesis work over deterministic approach has been employed [14]. In this approach data are selected from multiple arbitrary points (r, ), (r, ), (r, ) …(r, ). The fitting process involves both Newton-Raphson method and the minimization process associated with the least square method is applied to solve the set of equations in terms of the corrections K and K. The method is presented below: –
Equation (7) can be rewritten as
Consider any arbitrary function h of the form
| (9) | |
| (10) |
The least square minimization process is accomplished by multiplying from the left both sides of Equation (10) by the transpose of matrix , to give
| (11) |
or
| (12) |
where
| (13) | ||
| (14) |
Finally the correction terms are given by:
| (15) |
The solution of equation gives which are used to correct the initial estimates of K, K and obtain a better fit of the function f to m data points.
2.1.5 Finite element modeling
APDL code was used in the present investigation. First the photoelastic experiments results were used to evaluate and corroborate ANSYS results. Then the geometry shown below was analysed to study the effect of different positions of the stop hole.
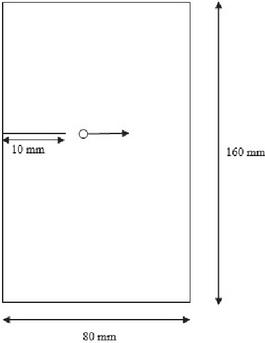
Figure 4 Specimen geometry for ANSYS (showing stop hole movement).
Plane stress conditions were assumed in the analysis. The model was discredited using 8 node 2D element (isoparametric) having 2 degrees of freedom. To account for the stress singularity at the crack tip special discretization was used. The parameters involved in the meshing around the crack tip were varied to obtain an optimized meshing plane. The mechanical properties used are Young’s modulus 200 GPa and Poisson’s ratio 0.33 the loading condition was uniaxial and stress applied was 100 MPa.
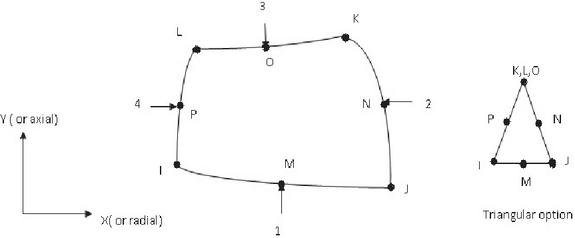
Figure 5 Plane 82 element used.
The stress intensity factors at a crack for a linear elastic fracture mechanics analysis is computed as follows:
| (16) | ||
| (17) | ||
| (18) |
Where, were evaluated based on the nodal displacements and locations.
3 Results and Discussion
Following results were obtained in the various tests conducted.
3.1 Experimental Corroboration of ANSYS Results
Both photoelasticity and ANSYS were employed to evaluate SIF for the geometry shown in Figure 2. From Figure 6 it can be seen that there is a very good agreement between results obtained from both the techniques.
An error of 4% was observed between the photoelasticity and ANSYS results. The values of N, r, were kept in the program and the result were obtained by running the program. The program converged in 15 steps and the error was minimized to 0.1%.
The obtained result was also verified using the J-integral approach. It was further verified using the analytical formula for a plate with a side crack under tension [32]. It can be observed that all the results are very close and the error involved is minimum.
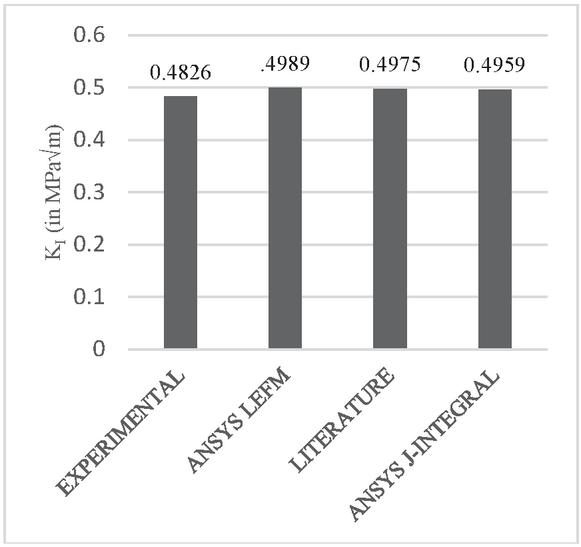
Figure 6 SIF obtained for Figure 2 by different techniques.
3.2 Variation of Lateral Distance
In the first part the distance of the stop hole from the crack tip in the lateral direction was varied and the variation of SIF was studied. The Figure 7 shows this variation. The values of SIF have been normalized with a plate with a side crack in tension without hole (K).
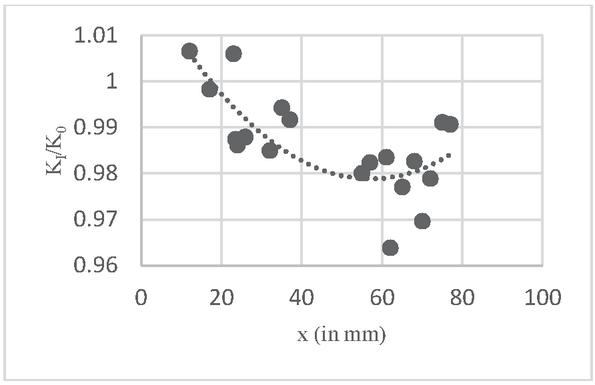
Figure 7 Variation of normalized mode I SIF with lateral distance (K SIF without any hole).
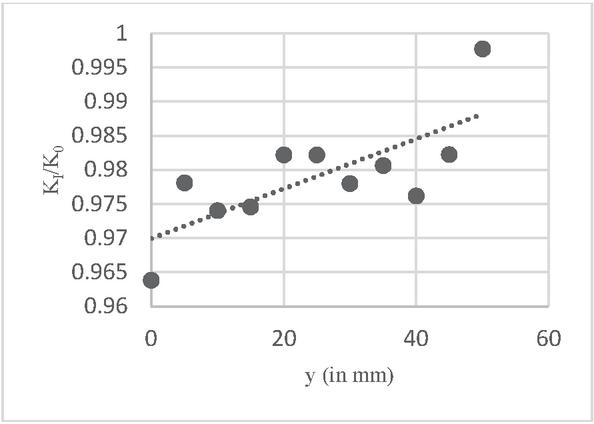
Figure 8 Variation of normalized mode I SIF with perpendicular distance (y distance taken from crack).
It can be observed that when the distance of the stop hole is increased or as the crack tip and stop hole centre move further apart SIF starts decreasing. But the trend starts changing as the distance becomes so significant that presence of a hole is nullified. It can be seen that at a distance of 1 mm from the crack tip the SIF has increased but its movement away from the crack tip results in decrease of SIF. Stop hole very close to the crack tip increases the stress around crack tip which is already high due to the stress singularity. Since due to drilling of the hole effective cross sectional area decreases at the crack tip SIF increases. As the hole moves away the SIF starts achieving the initial value, this may be attributed to the fact that effect of hole after a distance produced no effect on SIF it was seen that for the present geometry considered the hole at a distance of 62 mm beyond which the effect of presence of hole becomes insignificant. Now keeping this lateral distance as constant perpendicular distance is varied and its optimum position is identified.
3.3 Variation of Perpendicular Distance
Now keeping x as constant the perpendicular distance is varied. Figure 8 shows this variation. It is observed that similar to the lateral distance variation the increase in diatance in the perpendicular direction also results in decrease of SIF.
Presence of stop hole very near to crack results in decrease of SIF however it increases with further movement of the stop hole. However after a certain position it achieve the previous value of SIF (plate without hole). The optimum values now obtained are x 62 mm and y 80 mm.
3.4 Variation of Radius
At this optimum position of the stop hole its radius was varied. The initial hole size considered was 0.5 mm (smaller size were not considered keeping in mind the practicality). From Figure 9 it can be seen that as the hole size is increased from 0.5 mm the SIF drops but this drop is maintained for a small range of 0.5 mm to 1 mm.
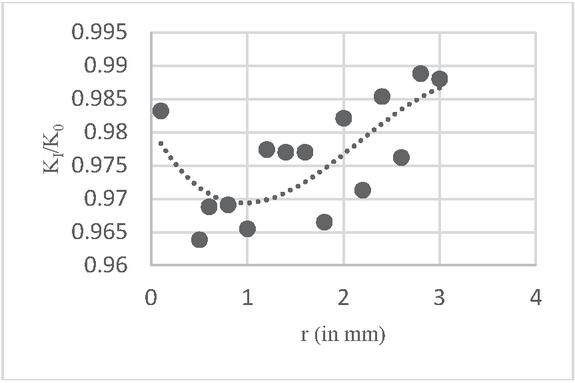
Figure 9 Variation of normalized mode I SIF with size of the stop hole.
Further increase in the hole size results in increase of SIF. However it is still below the case of a plate without hole. This can be attributed to the fact that as radius increases effective cross section area decreases thereby increasing the net effective stress distribution around the crack tip.
3.5 Effect of II Stop Hole
The effect of application of II stop hole was studied keeping the first stop hole at the optimum position. Figure 9 shows the results obtained.
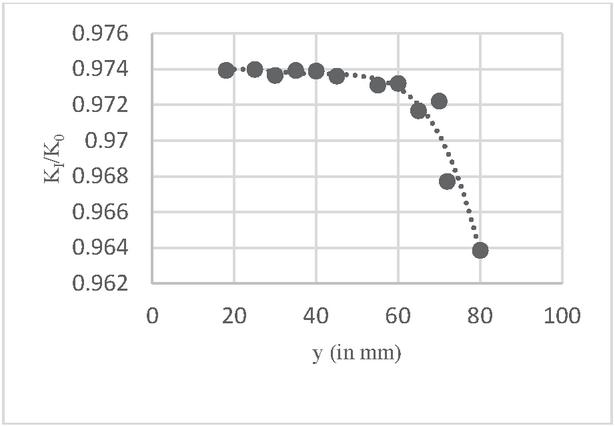
Figure 10 Variation of normalized mode I SIF with introduction of supplementary hole (y distance moves away from the 1st stop hole).
It can be seen form the Figure 10 that at first for a significant range there is not much effect of second stop hole but as the two holes move closer to each other the SIF starts decreasing, this can be attributed to mixed mode loading occurring at the crack tip and this mode mixity results in impediment of crack intensity. Comparing the two figs. It can also be seen that normalized value of SIF dropped from 0.97 to 0.96 with introduction of another hole.
4 Conclusions
From the above discussions following conclusions can be made:
1. It is observed that variation of lateral and perpendicular position of stop hole has a profound impact on SIF, which would depend upon the specimen geometry and loading conditions.
2. Radius of drill hole is also significant, making the hole too large deteriorated the problem therefore estimation of hole size becomes important.
3. Presence of a second stop hole is beneficial and helps in decreasing the stress intensity factor.
Keeping in mind the above points it can be said that stop hole technique is a beneficial technique for life enhancement. But the accurate estimation of its position and its size plays a pivotal role in degree of its effectiveness.
Acknowledgments
This research did not receive any specific grant from funding agencies in the public, commercial, or not-for-profit sectors.
Nomenclature
| APDL | Ansys Parametric Design Language |
| D | Diameter of Specimen (m) |
| f | Martial fringe value (N/m-fringe order) |
| G | Strain energy release rate (J/m) |
| h | Thickness of Specimen (m) |
| K, K | Mixed mode SIFs (MPam) |
| K | Mode 3 SIF (MPam) |
| K | SIF without any hole (MPam) |
| k | Poisson’s ratio (dimensionless) |
| N | Fringe Order (dimensionless) |
| P | Load Applied (N) |
| r | Polar coordinate respect to crack tip (m) |
| SIF | Stress Intensity Factor (MPam) |
| u | Displacement in x-direction (m) |
| v | Displacement in y-direction (m) |
| w | Displacement in z-direction (m) |
| Greek symbols | |
| Change in quantity | |
| Polar coordinate respect to crack tip (degree) | |
| Principal Stress (N/m) | |
| Shear stress (N/m) | |
| Subscripts | |
| I, II, III | For first, second and third SIF |
| 1, 2 | For principal stresses |
| m | For maximum in plane shear stress |
| xx | For simple stress in x direction |
| xy | For shear stress in 2-D stress system |
| yy | For simple stress in x direction |
References
[1] Domazet Z. Comparison of fatigue crack retardation methods. Eng Fail Anal 1996;3(2):137–47.
[2] Elber W. Fatigue crack closure under cyclic tension. Eng Fract Mech 1970;2:37–45.
[3] Sharp PK, Clayton JQ, Clark G. Retardation and repair of fatigue cracks by adhesive infiltration. Fatigue Fract Eng Mater Struct 1997;20(4): 605–14.
[4] Shin CS, Cai CQ. A model for evaluating the effect of fatigue crack repair by the infiltration method. Fatigue Fract Eng Mater Struct 2000;23:835–45.
[5] Ayatollahi MR, Hashemi R. Mixed mode fracture in an inclined center crack repaired by composite patching. Compos Struct 2007;81:264–73.
[6] Mendez PF, Eagar TW. Penetration and defect formation in high-current arc welding. Weld J 2003;82(10):296–306.
[7] Liu C, Northwood DO, Bhole SD. Tensile fracture behavior in CO2 laser beam welds of 7075-T6 aluminum alloy. Mater Des 2004;25:573–7.
[8] Song PS, Shieh YL. Stop drilling procedure for fatigue life improvement. Int J Fatigue 2004;26:1333–9.
[9] Ghfiri R, Shi H, Guo R, Mesmacque G. Effects of expanded and non-expanded hole on the delay of arresting crack propagation for aluminum alloys. Mater Sci Eng 2000;A286:244–9.
[10] Ghfiri R, Amrouche A, Imad A, Mesmacque G. Fatigue life estimation after crack repair in 6005 AT-6 aluminum alloy using the cold expansion hole technique. Fatigue Fract Eng Mater Struct 2000;23:911–6.
[11] Ayatollahi et al., Mixed mode fatigue crack initiation and growth in a CT specimen repaired by stop hole technique. Engg. Fract. Mech. 145, 2015, 115-127.
[12] James W Dally.
[13] Gope et al., Influence of crack offset distance on interaction of multiple collinearand offset edge cracks in a rectangular plate. The.& Appl. Fract. Mech., 2014, 19–29.
[14] R.J. Sanford, J.W. Dally, A general method for determining mixed mode stressintensity factors, Eng. Fract. Mech. 4 (1972) 357–366.
[15] K. Ramesh, S. Gupta, A.A. Kelkar, Evaluation of stress field parameters infracture mechanics by photoelasticity-revisited, Eng. Fract. Mech. 56 (1997) 25–45.
[16] V.K. Singh, P.C. Gope, Photoelastic determination of mixed mode stressintensity factor, J. Solid Mech. 3 (2009) 233–244.
[17] P.C. Gope, A. Thakur, Experimental investigation of crack growth directions in multiple crack problems, Fatigue Fract. Eng. Mater. Struct. 34 (2011) 804–815.
[18] V.K. Singh, P.C. Gope, Experimental evaluation of mixed mode stress intensity factor for prediction of crack growth by phoelastic method, J Failure Anal. Prevent. 13 (2013) 217–226.
Journal of Graphic Era University, Vol. 11_1, 103–116.
doi: 10.13052/jgeu0975-1416.1118
© 2023 River Publishers