Personnel Risk in Assessing the Effectiveness of Ground-based Tests of Complex Technical Systems
Andrei V. Kirillin1, 2,* and Pavel A. Iosifov1
1Russian Federation, Moscow, Volokolamskoe shosse, 4, Russia
2Russian Federation, Zhukovsky, Bazhenova st. 10A, Russia
E-mail: kirillinav@mati.ru
*Corresponding Author
Received 09 November 2021; Accepted 17 February 2022; Publication 29 March 2022
Abstract
The article provides an original approach to taking into account the risk of personnel in the process of assessing the effectiveness of testing complex technical systems. Models of assessment and predictive models of personnel risks based on the study of their qualification level are considered. The advantages and limitations of the given approach to the analysis and accounting of personnel risks are shown.
Keywords: Testing effectiveness, human reliability, reliability growth model, logistic distribution.
1 Introduction
The main purpose of any test is to detect and eliminate defects that can lead to a decrease in the efficiency of the corresponding products.
The manifestation of defects in certain types of tests is a random process, depending both on the nature of the defect and on the test conditions. Thus, defects sensitive to vibrations appear during vibration tests, sensitive to temperature changes – during temperature tests, etc.
When carrying out combined tests, for example, thermal vacuum, in addition to defects sensitive to temperature and vacuum, defects appear due to the interaction of these factors. In addition, during testing, defects may appear that do not strictly belong to one category or another.
2 Methodology for Evaluating the Efficiency of Ground-based Tests of Complex Technical Systems
Based on this definition of test objectives, it is advisable to use the probability of undetected defect, which is an analogue of the probability of failure-free operation, as an indicator of their effectiveness. This approach was first proposed by M. Lind in work [1] and further developed in works [2] and [3] for theoretical substantiation and empirical models of increased reliability that are widely used in practice due to the elimination of detected defects [4, 5]. The main used reliability growth models are shown in Table 1.
Table 1 Models of reliability growth used in experimental testing
| Model | Author |
| ; ; | Gross, Cammins |
| ; | |
| ; | Lloyd, Lipov |
| Gompertz | |
| Chervoni, Luk’yaschenko, Kotin | |
| Volkov |
At the same time, it remains possible to use the developed mathematical apparatus of the theory of reliability.
In accordance with the proposed approach, the probability of undetected defects is chosen as an indicator of the effectiveness of a certain i-th type of tests for the simplest exponential model
where – detection rate of i-th type defect; – time of the i-th test.
In this case, it is assumed that without testing , but with , , i.e. with a sufficiently long test, all defects of this type will be identified.
When carrying out n tests of several types (for example, when implementing integrated tests as part of a comprehensive experimental development program), the total intensity of defect detection will increase, and the probability of undetected defects will decrease, which corresponds to a series connection in terms of reliability:
Introducing the total time of the complex of tests T, we get:
where the total detection rate of defect is defined as
where – the share of tests of the i-th type in the overall test program.
3 The Approach to Accounting of the Personnel Risk in Tests Effectiveness Estimation Process
At the present time, there are many approaches to estimate human reliability. Most of them are consist the base of human reliability analysis methods (HRA). Most fully these methods are described in the works of prof. Hollnagel [7] and prof. Liao [8–11]. One of the main direction in research in the area of HRA is the evaluation of the applicability of these methods in various engineering applications. The issues of assessing the cognitive human reliability and the extension of the THERP analysis are most fully considered in prof. Zhang Li works [12]. The tasks of mathematical statistical modelling of human MTBF as an one of the reliability parameter of complex technical system were successfully solved at the University of Brno. The results of applying the Monte-Carlo metod are given in [11].
The authors have highlighted the fact and have talked about the importance of various tests that help the testing team to locate defects existing on the software system. They have worked to evaluate the effectiveness of these test models by defining the mathematical forms of probability of indicated defects by the test. Personnel risk in the effectiveness estimation process by incorporating HRA.
As you can see from the above review of publications by various authors, there are two ways for reliability assessment in HRA models and methods. The first way contains estimates for probabilistic assessmenting. Moreover, the second way is contains estimates as result of cognitive reliability assessmenting. All of these points have consider human as a unit with full knowledges. It means that human have 100% readiness level of working with tech objects, systems and equipment. The practice of operation tech objects are shown impossibility to achieve of extremely high levels of human reliability exception on early stage operation. In addition, usually we haven’t see absolute reliability of all system parts (include human too). In the best case, it approximately 100%. The authors set the target to create an approach for assessment of engineer-operator readiness level based on their competencies and knowledge assessment. It can be apply to correct the HRA results, affectivity estimates of ground-based operations, and other related cases.
The above methodology for assessing the effectiveness of tests allows you to easily and visually take into account the possible incompetence of the testing personnel.
Indeed, the incompetence of staff can lead to both failure to detect failures and the introduction of additional errors. All this leads to an increase in the probability of undetected defects, which, within the framework of the proposed approach, corresponds to a parallel connection in terms of reliability (Figure 1):
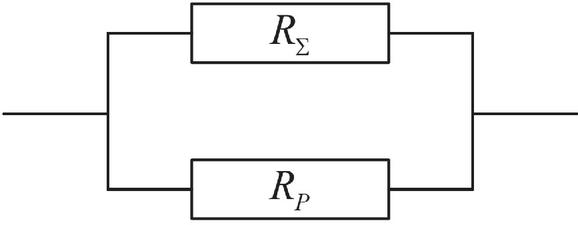
Figure 1 Personnel risk accounting scheme during testing: – total probability of non-detection defects; – personnel risk.
As a result, the final probability of non-detection defects by determining:
| (1) |
wherefrom
those. the probability R, in contrast to , will not be distributed in the interval , but in a narrower interval , where is the lower limit of the values of the total probability of non-detection of defects.
Let us illustrate the proposed approach with a specific hypothetical example, which allows us to identify the main regularities in the application of this approach.
Let . Then , i.e. increases almost 2 times in comparison with the option without taking into account the influence of personnel. With a decrease in to 0.05, we get . Further, reducing to 0.01, we get .
Thus, analyzing the calculation results of this elementary example, the following interesting conclusions can be drawn:
– reducing the risk of personnel by 5% leads to a change in the probability of undetected defects by approximately 25%, and with a decrease in risk already by 10%, we observe a change in the probability of undetected defects by approximately 50%.
– the ratio practically does not change the final probability of undetected defects.
Note that the ratio coincides with the recommendation of tolerance control for the choice of the ratio between the tolerance for the spread of the controlled parameter and the value of the random error of the measuring instrument.
Note also that when you change and save the recommendation , the ratios obtained in the example are preserved.
So, with , and with , and .
Let us give an approach to estimating .
4 Estimation and Prognosis Human Risks
Let us consider the main models for assessing and predicting human risk. One of the most native evaluation methods is the integral estimate in nominal scale (True/False) of the frequency , where M – the number of correctly performed technological operations, and – the sample size, where n – the number of human in the group and k – the number of operation which need to control [14].
This probability, which characterizes the degree of performed operation success, depends both on the initial preparedness of the employees and on the content and description quality of the technological operation. The level of complexity should be correlated with the degree of preparedness of employees and the perception of documentation [15–22]. A statistical model that allows to evaluate the effectiveness of performed operations, taking into account both the degree of preparedness of employees and the degree of complexity of the documentation, is the logistic model by Georg Rasch [23]:
| (2) |
where – level of difficulty of control task, – level of preparedness of employees.
Logistic probability distribution is symmetrical with zero expected value (at , ), dispersion and .
Let to introduce the transform of Rasch’s model argument:
where .
During the testing we are able to assessment readiness level of employee group which solving tasks with a constant complexity level as well as the tasks complexity level with a constant group composition [3, 24, 25].
Since, the logistic Rasch’s model is statistical, it allows a one-time estimation of the effectiveness of employee’s trainings.
In employee’s training process for complex tools working, the reliability and operational safety of the equipment depend on the human reliability factor. And, the directives for the readiness of the employees are exceedingly high. And mostly non-recurrent training may not be enough. In this case the question of planning whole training process is current, and firstly the task about solve the right training cycles quantity.
The task of calculating the training cycle quantity can be solved with using reliability growth mathematical models. The reliability growth models are mass applicate in different areas as reliability development models, for example, in substantiating the number of test cycles during experimental ground-base system testing [3]. The case of estimating the dynamics of training effectiveness is close to the task of the dynamics reliability assessment of the product, depending on the quantity of tests. After each test cycle the product is refined in order to eliminate defects identified during testing, increasing its reliability.
The control of employees’ knowledge can be considered as their test, and the identified unlearning fragments or theme, as learning defects that require to research.
Let show the logistic model of reliability growth [21]:
| (3) |
At the number of cycles , ; at , .
It is easy to see that model (3) is a special case of model (2), when , , and only positive values are considered leading to increased reliability . Also in the model (3), the parameter , but in the model (2) – random variable, the indirect measurement of which is based on an estimate of the probability by the frequency.
Let rewrite model (3) in the equal discrete recurrent form:
whence after simple transformations the following is obtained
and finally we can pass to the model (2) symbols, the prediction equation for 1st step we can write as:
| (4) |
where – the estimates obtained by processing information on previous cycles up to .
Get sight of the growth model shown. It consider the number of cycles and show growth rate :
Let use as the arithmetic mean estimate as estimate of the parameter
Equation (4) can be expanded to predict more than one step forward, for example:
etc.
5 Examples and Discussion
Let show the reviewed method in some gypotetical examples.
Example 1. The requirement of human reliability is , i.e. Rasch’s argument is . Employees have pass exam with 60% rightness of test operations. In Rasch’s terms it is:
Let use formula (4) and its recurrent form to calculate the necessary number of training cycles to improve employee’s readiness R to requirement volume . The results are shown in Table 2.
Table 2 Depending training cycles on employee’s readiness
| Human Reliability | Employee’s | Required Quantity of |
| Requirement, | Readiness, | Training Cycles, n |
| 0,99 | 0,6 | 10 |
| 0,7 | 4 | |
| 0,8 | 2 | |
| 0,9 | 1 | |
| 0,999 | 0,6 | 16 |
| 0,7 | 7 | |
| 0,8 | 4 | |
| 0,9 | 2 |
Let show case with extremely high volume of human reliability requirement.
Example 2. The set value is very high, and equal to 0,999999, i.e. . At the level of readiness , in this case learning cycles will be required.
In the practice of applying of the proposed approach the question of the decisions rightness can arise. The probability in the model (2) is a monotonically increasing function of the parameter . The lower confidence limit of the evaluation of this probability by frequency corresponds to the lower confidence limit of an indirect measurement . The result is a simple practical technique for taking errors into account when replacing the true probability value P with its estimate , shown that.
Use the normal approximation of the binomial distribution, the lower 90% confidence limit is obtained at :
where – quantile of standard normal distribution.
Let assume that as a result of first-cycle control of 20 employees were made on 40 control technological actions (). And 600 of them were correct i.e. .
Let calculate lower confidence limits and the necessary quantity of training cycles (calculation is carried out like to example 1) to getting level. The results are shown in Table 3.
Table 3 The calculation results of Example 2
| Quantity of Correct | The Frequency | Lower Confidence | Required Quantity of |
| Technological Actions, M | Estimate, | Limits, | Training Cycles, n |
| 600 | 0,75 | 0,73038 | 13 |
| 625 | 0,78125 | 0,762519 | 11 |
| 650 | 0,8125 | 0,794815 | 9 |
| 675 | 0,84375 | 0,827298 | 8 |
| 700 | 0,875 | 0,860015 | 7 |
| 725 | 0,90625 | 0,893043 | 6 |
| 750 | 0,9375 | 0,926532 | 4 |
| 775 | 0,96875 | 0,960866 | 3 |
As you can see, an increase in the training effectiveness by 5% leads to a decrease in the training volume by more than 30%.
Example 3. Let ground tests of the system be carried out, in which the risk of not detecting a failure is 0,1 and 0,01. Let us determine the level of preparedness of employees that would not worsen the risk of not detecting defects and the number of training cycles to achieve this level. Let accept the personnel risk start level is equal risk of non-detected failure. The calculation results are shown in Table 4.
JK1cmyk0.14,0.10,0.11,0
Table 4 The calculation results of Example 3
| Required Quantity of | |||
| Risk of | Training Cycles to | ||
| Non-detecting | Personnel | Total Risk | Achieve Personnel Risk |
| Failure, | Risk | Level | Target Level, n |
| 0,1 | 0,1 | 0,19 | 2 |
| 0,05 | 0,145 | 1 | |
| 0,01 | 0,109 | 1 | |
| 0,005 | 0,1045 | 1 | |
| 0,004 | 0,1036 | – | |
| 0,01 | 0,1 | 0,109 | 3 |
| 0,05 | 0,0595 | 2 | |
| 0,01 | 0,0199 | 1 | |
| 0,005 | 0,01495 | 1 | |
| 0,001 | 0,01099 | 1 | |
| 0,0005 | 0,010495 | 1 | |
| 0,0004 | 0,010396 | – | |
| In Table 4 risk target value has colored. |
As you can see, the Rasch’s model based approach allow to fend away the personnel risk at counted training cycle quantity. This approach could using at the some other areas, besides task of ground-based tests effectivity assessment.
6 Conclusion
The given logistic model is very sensitive to the composition of groups of workers. This aspect was studied in detail by the authors in [24]. In view of this fact, the application of this approach is not recommended for dynamic teams of workers where there is a high turnover of personnel. The results of applying the learning planning approach to such groups are highly uncertain.
On the other hand, the above methodology showed itself well when used in formed groups of workers, for example, in the case of mastering new types of machinery and equipment. Thus, the developed methodology allows planning and managing a multi-stage learning process, providing a high level of knowledge-based personnel reliability. And as a result – a high level of probability of detecting defects during testing.
References
[1] Lind M. ‘The Mathematical Model of Testing Products’, Questions of Space-rocket Techniques, pp. 3–14, No. 12, 1970.
[2] Krinetsky E.I, and others. Flight tests of aircraft control systems. p. 193, 1975.
[3] Aleksandrovskaya L.N. and others. Theoretical basis of the test and experimental development of complex technical systems, p. 735. 2003.
[4] Krinetsky E.I. and others. Flight tests of rockets and spacecraft. p. 462, 1979.
[5] Krinetsky E.I. and others. Aircraft Testing Fundamentals. p. 312, 1989.
[6] Hollnagel E. 1996 ‘Reliability Analysis and Operator Modelling’, Reliability Engineering and System Safety, pp.327-337, \textnumero52, 1996.
[7] Liao H., Forester J., and others. ‘Assessment of HRA method predictions against operating crew performance: Part I: Study background, design and methodology’. Reliability Engineering and System Safety, 191, 2019.
[8] Liao H., Forester J., and others. ‘Assessment of HRA method predictions against operating crew performance: Part II: Overall simulator data, HRA method predictions and intra-method comparison’. Reliability Engineering and System Safety, 191, 2019.
[9] Liao H., Forester J., and others. ‘Assessment of HRA method predictions against operating crew performance: Part III: Conclusions and achievements’. Reliability Engineering and System Safety, 191, 2019.
[10] Zang L., He X., Dai L., and others. ‘The Simulatior experimental study on the Operator Reliability of Qinhan nuclear power plant’. Reliability Engineering and System Safety, pp. 252-259, \textnumero 92, 2007.
[11] Jirgl M., Havlikova M., and others. ‘Monte Carlo Reliability Analysis of System with Human Operator’. IFAC-PaperOnLine, pp. 272–277, 49–25, 2016.
[12] Avanesov V.S. ‘The problem of psychological tests’, Soviet Education, pp. 6–23, vol. 22, no. 6, 1980.
[13] Donihue M. Meeting the Standards: An Analysis of Eight Grade Educational Assesment Test Scores in Maine, 2006.
[14] Haertel E. ‘Tests, Test Scores, and Constructs’. Educational Psychologist, pp. 1–14, \textnumero 53, 2018.
[15] Violato C. Statistics and test score interpretation, 2018.
[16] Thissen D., Wainer H. (Eds.). Test Scoring. Journal of Educational Measurement, pp. 265–268, 39(3), 2002.
[17] Engelhardt L., Goldhammer F. ‘Validating Test Score Interpretations Using Time Information’. Frontiers in Psychology, 2019.
[18] Kleinberg J., Raghu M. ‘Team Performance with Test Scores’. Proceedings of the Sixteenth ACM Conference on Economics and Computation – EC ’15, 2015.
[19] Rasch G.E. Probabilistic Models for Some Intelligence and Attainment Tests, 1993.
[20] Peterson J.K. ‘Logistics Models’. Cognitive Science and Technology, pp. 257–277, 2016.
[21] Hand D. J., van der Linden W. J., & Hambleton R. K. Handbook of Modern Item Response Theory. Biometrics, pp. 1680, 54(4), 1998.
[22] Aleksandrovskaya L.N., Kirillin A.V., Shumskaya L.P. ‘Mathematical models in assessing the effectiveness of continuing education’. Quality. Innovations. Education, pp. 30–34, \textnumero8 (111), 2014.
[23] Aleksandrovskaya L.N., Kirillin A.V., Iosifov P.A., Mitrofanova I.P. ‘A model for evaluating the effectiveness of retraining of specialists in multilevel studying’. Quality. Innovations. Education, pp. 3–10, 1(116), 2015.
[24] Aleksandrovskaya L.N., Kirillin A.V., Borisova E.V. ‘Statistical analysis of homogeneity of students’ preparedness’. Quality. Innovations. Education, pp. 5–1, 6(157), 2018.
[25] Tsoularis A., Wallace J. Analysis of logistic growth models. Mathematical Biosciences, pp. 21–55, 179(1), 2002.
Biographies

Andrei V. Kirillin B.Sc., M.Sc. From 2014 for nowadays – senior lecturer at chair “Test and Operation Technology” of Moscow Aviation Institute. From 2022 for nowadays – reliability engineer at Avionic Department of LLC NIK. Scientific Interests areas are in system safety assessment and human reliability analysis.

Pavel A. Iosifov Graduated Moscow State Aviation and Technological University named after K.E. Tsiolkovsky at 1997. Since 2001 PhD degree in Aviation Engines and Powerplans. Since 2014 head of faculty “Aerospace high technologies and manufactures” of Moscow Aviation Institute. Scientific Interests areas are in information systems and information support of flight vecehles production, tests and service.
Journal of Graphic Era University, Vol. 10_1, 13–26.
doi: 10.13052/jgeu0975-1416.1012
© 2022 River Publishers