Application of Lean Manufacturing Using Kaizen Analysis: A Case Study
Amit Surya*, Rakesh Kumar and Rajeev Trehan
National Institute of Technology, Jalandhar, India
E-mail: amits.ip.22@nitj.ac.in; sharmark@nitj.ac.in; rtrehan@nitj.ac.in
*Corresponding Author
Received 10 April 2024; Accepted 27 April 2024
Abstract
Industrial production and operation have been completely transformed by lean methods made possible by lean management (LM) technologies in the industry. This paper investigates industry practices regarding the application of lean tools in the manufacturing sector. For the purpose of gathering data, a questionnaire survey was distributed among the manufacturing professionals in the organization where lean manufacturing has already been adopted. The purpose of the study is to highlight the perceived level of their contribution to operational performance. In order to access operational performance, the study uses lean tools such as root-cause analysis, kaizen hypothesis, and evaluation of kaizen hypothesis, as well as before and after comparison. The study confirms that widespread adoption of lean practices results in a decrease in setup time from 28 minutes to 6 minutes, an increase in productivity by 50 components per month, a reduction in average wheel damage, and average components being reworked.
Keywords: Lean manufacturing, root-cause analysis, automotive industry.
1 Introduction
In the modern production world, every company seeks to cut costs as quickly as possible without sacrificing quality. A well-designed lean manufacturing system (LMS) combines several techniques for eliminating wastes that are frequently found on shop floors to achieve these objectives [1]. Lean manufacturing is a method that focuses on eliminating waste and is used to lower production costs without sacrificing the quality of the items produced [2]. In response to issues the Japanese industry experienced following World War II, including scarce resources and challenging access to raw materials, kaizen was introduced. As a result, Japanese businesses began researching ways to maximize process efficiencies and reduce waste in their production processes [3]. Lean manufacturing challenges the traditional production approach, which places emphasis on the system’s inventory. Inventory is viewed as an organizational waste by the “Lean” approach. If a business wants to implement lean manufacturing, it is critical that they comprehend the distinctions between lean manufacturing and traditional manufacturing [4]. In its most basic form, lean manufacturing which has its roots in the Toyota Production System, which dates back to the 1950s, is totally unaffected by information and communication technology. But more study is being done to see if lean manufacturing and ICT can work together to improve performance, as more sophisticated ICT solutions come to market [5]. To cut down on production waste, lean manufacturing employs techniques such as kaizen, one-piece flow, synchronous manufacturing, inventory management, poka-yoke, standardized work, workplace organization, and scrap reduction [6].
2 Literature Review
Several manufacturing companies have adopted lean systems because they reduce waste and improve lead times for production. For instance, it is employed to increase the productivity and process efficiency of the metal production industry, and significant progress has been made in this regard [7]. The adoption of lean production practices in the Australian manufacturing industry was studied by Sohal and Egglestone (1994). A phone poll was used to collect information from 51 businesses that represented various industry sectors. According to the report, the vast majority of the businesses were implementing lean manufacturing techniques [8]. Lean production techniques, according to Pakdil and Leonard (2014), give manufacturing companies a significant competitive edge since they create effective systems that consume fewer resources, creating higher quality and lower costs [9]. Chiarini (2011) conducted nine-year research in European organizations that were at a mature stage of lean implementation and had obtained ISO 9001 certification. According to the author, the organization can become more efficient and standardize its lean practices, such as kanban, total productive maintenance (TPM), kaizen events, lean metrics, and others, by integrating lean with the ISO 9001 management system [10]. Lean manufacturing and performance management (PM) have evolved from marginal ideas to important topics in operations management (OM) over the last 20 years. The field of lean manufacturing has grown significantly and is now studied independently [11]. Kanbans, production leveling, single-minute exchange of dies (SMED), and cellular manufacturing are examples of just-in-time techniques. Shingo created the SMED family of processes, which reduce the manufacturing changeover time to less than 10 minutes [12]. As they relate to application, lean management principles can be divided into five categories: defining value, mapping the value stream, producing flow, establishing pull, and chasing perfection. When implementing lean, those five principles can serve as guidance. Efficiency, productivity, and cycle time can all be greatly improved with proper and consistent implementation. Consequently, Lean can be applied as a methodology and as a set of competencies to increase an organization’s competitiveness in the market [2]. Currently, lean production uses lean tools like Kaizen, Kanban, 5S, JIT, VSM, et al. to minimize lead times, inventory, and cycle times, enhance product quality, increase productivity, and eliminate manufacturing waste [13]. Kaizen, comprehensive quality management, lean manufacturing, and lean Six Sigma were all part of the process optimization methodology. Because it focuses on resource utilization and the elimination of non-value-added tasks, lean is one of the most popular techniques in the current environment [14]. Value Stream Map (VSM), Total Productive Maintenance (TPM), Just-in-Time (JIT), single-minute exchange of dies (SMED), Poka-yoke/Mistake-proofing, 5S, Kanban, and Ishikawa diagrams are among the most widely utilized Lean technologies, according to several writers [15]. In order to attain competitive manufacturing performance characteristics, a variety of LM tools have been used to improve sustainability indicators and increase intra- and intercompany sustainability performance effectiveness [16]. When implementing Kaizen, businesses place a heavy emphasis on the involvement of factory floor workers, providing them with a certain amount of empowerment to recognize and resolve workplace-related issues. When applied properly, kaizen can inspire workers to approach their work in new ways, improve morale, and increase workers’ sense of accountability for their workplace [3].
3 Company Profile
The company XYZ (name withheld to protect company privacy) was established in 1974. The first tractor of 26.5 H.P. (Model 724) was commercially introduced in 1974 with an initial capacity of 5000 tractors per year. At present, the plant is manufacturing eight tractor models, ranging from 20 H.P. to 42 H.P., with more than 40 variants and a current capacity of 49,200 tractors per year. The plant is established in a 97,000-square-meter area and has the flexibility to produce all models. The plant is also manufacturing gears and shafts for other divisions. The plant is certified for ISO 9001:2008, ISO 14001:2004, and OHSAS 18001:2007. The company’s vision is to be among the top two brands in India by 2028, and its mission is to bring farm technology prosperity and enable stakeholders to rise.
4 Methodology
In order to carry out the intended tasks for the TPM implementation, the TPM committee was formed and led by a chairman. The TPM committee has a team of up to 7–8 members representing heads of different departments, and the chairman is usually the plant head. The role of the committee is to record, categorize and analyze 16 losses (except break down and defect losses) machine-wise and department-wise. Calculation of OEE and set targets for eliminating losses. Working in close co-ordination with other sub-committees to achieve the set targets. The committee meets at least once a week or month to achieve the set targets. The committee used methods such as FMEA, Kaizen, WHY-WHY analysis, and others.
FMEA (Failure Mode and Effects Analysis) It is a systematic approach to identifying potential modes in a system, product or process, and assessing their impact on performance. By identifying failure modes and their effects, organizations can prioritize and implement actions to prevent or mitigate these failures. It is calculated by using the formula: RPN SOD
Whereas
RPN Risk priority number
S Severity of the event
O Probability of occurrence
D Probability of detection
WHY-WHY Analysis is a simple but powerful tool for problem solving and root cause analysis. It involves repeatedly asking “why” until the root cause of the problem is identified. By doing this, organizations can address the root cause of the problem. Kaizen is a Japanese term that translates to continuous improvement. It refers to the practice of continuously making small, incremental improvements in processes, products and systems. Kaizen emphasizes the involvement of all employees in identifying opportunities for improvement and implementing changes, leading to increased efficiency, quality and employee engagement. The company designed TPM policies, objectives, targets, organizational structure, and key procedure so that everyone participating in TPM implementation could clearly understand the defined aims. The company formulates the TPM policy by emphasizes on: –
• Maximize reliability of plant & machinery
• Nature team work & continual improvement
• Total Employee involvement.
• Promote healthy, clean & cheerful working environment.
• Cultivate my machine, My workplace culture
The company formulates the TPM objectives by emphasizes on: –
• Zero Breakdown
• Zero Accident
• Zero Defects
• Zero Pollution
• Increase OEE 85–90%
The company formulates the TPM targets by emphasizes on: –
• To increase the productivity efficiency and quality
• To Reduce scrap or rework
• To reduce Accidents, Defects, Breakdowns, Pollution to Zero.
• To reduce setup & adjustment losses using tools like SMED.
• To reduce Rejection of the work pieces
The company’s organizational structure and procedure: –
The implementation of all eight pillars played an important role in improving the overall equipment effectiveness (OEE) of a plant and thus successfully implementing the TPM in the industry. These pillars also help to reduce losses like downtime losses, idling and minor stoppage losses, speed losses, yield losses, etc. The implementation of all these pillars is important to obtain the desired results of TPM. The Kobetsu Kaizen (KK) pillar, named as focused improvement, is the most powerful TPM pillar, which can rectify 70 to 80% of the shop floor problems in the industry.
Data is gathered using a questionnaire that was created for the purpose and through interviews with professionals in the field as well as a survey of workers.
4.1 Implementation of TPM Pillar
The successful implementation of Total Plant Maintenance (TPM) in the industry may be attributed to the application of all eight pillars, which together increase a plant’s OEE. Thus, the implementation of TPM pillar discussed here:
1. Jishu Hozen (Autonomous maintenance)
2. Kobetsu Kaizen (Focused maintenance)
3. Planned maintenance
4. Hinshitsu Hozen (Quality maintenance)
5. Education & Training
6. Office TPM
7. Tool Management
8. Safety Health & Environment
4.2 Focused Improvement Pillar
Kobetsu Kaizen is a Japanese term that is also called focused maintenance. Focused Improvement, or Kobetsu Kaizen (KK), pillar of TPM involves activities that maximize the overall effectiveness of equipment, processes, and plants through the uncompromising elimination of 16 types of losses and improvement of performance. The team identifies and designs activities to eliminate or minimize the 16 losses, which are carefully measured and evaluated. The focused improvement pillar activity includes:
• Defining and understanding of the 16 major losses
• Formulation of a structured approach for eliminating/minimizing those losses
• Methodology for calculating OEE
• Preparation of Loss tree and loss-cost matrix.
The different types of losses are:
(1) Shut-Down (2) Equipment failure (3) Set-up change; (4) Tool change loss (5) Start up loss (6) Management loss (7) Motion loss (8) Measurement and adjustment loss (9) Minor stoppages and idling losses (10) Speed loss (11) Line organization losses (12) Defect or Rework (13) Energy loss (14) Die, jig and tool loss (15) Yield loss; (16) Logistic loss. These losses can be eliminated by using a master plan. The master plan includes all those activities that are required to achieve the TPM target of zero losses and is strictly followed by all the pillar members.
Continuous improvement, also called focused maintenance (KK), plays a crucial role in the overall success of TPM implementation within the industry. In order to carry out KK pillar activities, a systematic approach was followed to achieve the KK pillar targets. The seven step approach followed is described as:
(1) Data collection and analysis
(2) Identification of critical machines and prioritize the losses using loss-cost matrix
(3) Calculate the OEE before and set the target for prioritize losses.
(4) Analysis of problem
(5) Implementation of kaizen
(6) Result achievement
(7) Standardization and horizontal deployment
4.3 Formulation of Team for Focused Improvement Pillar
The pillar team, which consists of the pillar head and additional team members, will address the KK pillar challenges. The team members used a systematic strategy in addition to all necessary actions to offset the losses that were occurring in the KK pillar. Depending on the need to research a certain machine, the department head should serve as the leader, and the members come from production, tool room, tool design, production engineering, quality, etc. The role of the team members was to identify the losses machine-wise. OEE is calculated from the eight major losses occurring in the production and inspection departments. Cost related losses like spare parts, coolant, and lubricants are collected by the maintenance department, and tool losses are collected from the tool management center. Vendor related losses are collected from the quality maintenance team, and management losses are collected from the office TPM team. Operating motion loss and line organization loss are collected from industrial engineering, and logistic losses are collected from the office TPM team.
4.4 Formulation of Master Plan
To ensure that operations are carried out in a planned manner, the pillar head and members of the KK pillar team draft the master plan, which is displayed in Table 1. All pillar members adhere carefully to this master plan, which contains all the activities necessary to meet the TPM aim of zero losses.
Table 1 Master plan for KK pillar
| Steps | Activity |
| 1 | Loss capturing on all machines and data collection |
| 2 | Prepare loss cost matrix |
| 3 | Prioritize losses based on loss cost matrix |
| 4 | Kaizen theme and goal setting |
| 5 | Mapping out kaizen plan |
| 6 | Implementation of kaizen |
| 7 | Monitoring of savings achieved |
| 8 | Horizontal deployment |
| 9 | Calculation of OLE and OPE |
| 10 | Improvement in OLE and OPE |
4.5 Loss Capturing and Data Collection
To improve the equipment’s efficiency, the team started the loss capturing process, and it was found that the internal grinding machine was most affected. The grinding wheel was not visible through the shaft, which made it difficult to adjust the touch position.
4.5.1 Loss capturing format
The loss capture format, as shown in Table 2 below, was prepared in order to facilitate the data compilation of the equipment. Data compilation is done from September 2022 to October 2022. The losses are identified machine-wise. Cost related losses are collected by the maintenance department, and tool-related losses are collected from the tool management center. Vendor-related losses are collected from the quality maintenance team, and management losses are collected from the office TPM team. The losses are captured by an employee during his working period or shift on the due date. The different losses on different machines should be noted down in the loss-capturing format with their magnitude. Setup time loss, wheel damage loss, and components reworked due to improper adjustment were the highest on the loss-capturing formats. Based on the loss capture format, the average set-up time per setting is 28 minutes, the average grinding wheel damage per setting is one wheel, and the average component reworked per setting is 3 components.
| Setup Time for | Wheel | Component Reworked | ||
| Date | Shift | ‘Bull Pinion Shaft Left’ | Damaged | Due to Improper Adjustment |
| 26-09-2022 | A | 25 | 1 | 3 |
| 29-09-2022 | B | 25 | 1 | 3 |
| 01-10-2022 | B | 30 | 1 | 4 |
| 04-10-2022 | B | 35 | 2 | 4 |
| 07-10-2022 | A | 20 | 1 | 2 |
| 10-10-2022 | A | 28 | 1 | 3 |
| 13-10-2022 | B | 25 | 1 | 3 |
| 15-10-2022 | B | 30 | 1 | 4 |
| 18-10-2022 | A | 30 | 1 | 4 |
| 21-10-2022 | A | 25 | 1 | 3 |
| 22-10-2022 | B | 30 | 1 | 4 |
| 24-10-2022 | A | 25 | 1 | 2 |
| 25-10-2022 | B | 35 | 2 | 3 |
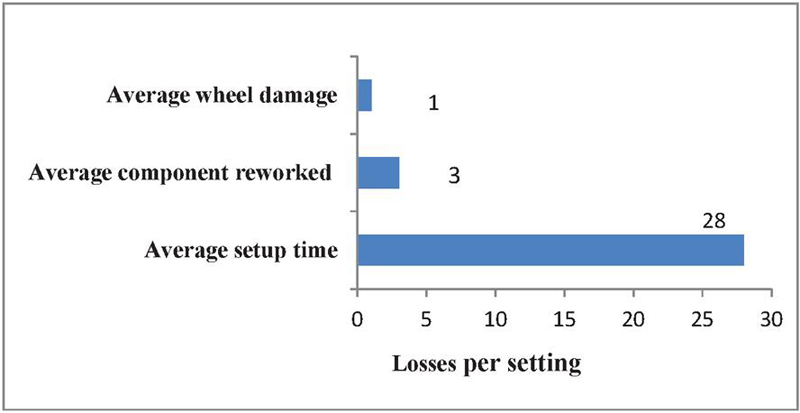
Figure 1 Loss prioritization.
4.6 Loss Prioritization Based on Loss Capturing Format
To prioritize the losses, loss cost relationship matrix is prepared with the help of account department considering the variable as well as fixed cost. The loss prioritized as following: –
(1) Average setup time loss
4.7 Tool Used for Analysis
(1) Root-cause analysis
(2) Kaizen hypothesis
(3) Before-After comparison
The effectiveness of the reduction of setup time loss measured and evaluated by using these quality control tools.
The KPI’s used to assess the impact of improvement were:-
(1) Setup time duration
(2) Setup time reduction percentage
(3) Frequency of setup
(4) Downtime percentage
(5) Idle time reduction
(6) Overall Equipment Effectiveness
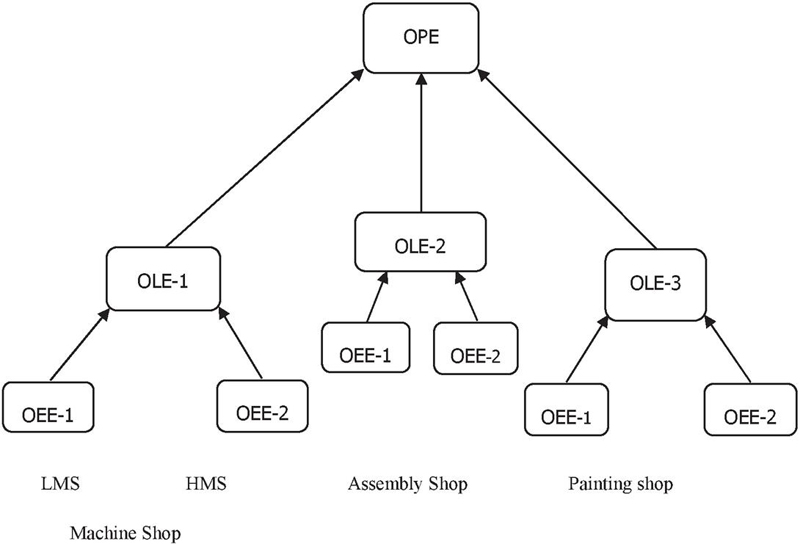
Figure 2 Bifurcation of LMS and HMS.
4.8 Bifurcation of LMS and HMS Department
The machine shop, assembly shop, and paint shop are the sub-sections of the plant. The overall equipment efficiency (OEE) of all machines in all three shops was calculated. Then the OEE of all equipments in a single line was compiled to obtain overall line efficiency (OLE). The OLE of all three shops was compiled to get the overall plant efficiency (OPE) as shown in figure above.
4.9 Reduction of Setup Time Loss
There are two main shops: LMS (light machine shop) and HMS (heavy machine shop). Now these two shops are bifurcated into subgroups (grinding, turning, hobbling, shaving, and drilling). The setup time loss is taking place in the grinding section of the LMS (light machine shop) department. After studying the bifurcation of the subgroups, it was concluded that the internal grinding machine (conventional) covers almost 45% of the setup time, or 30 minutes per setup.
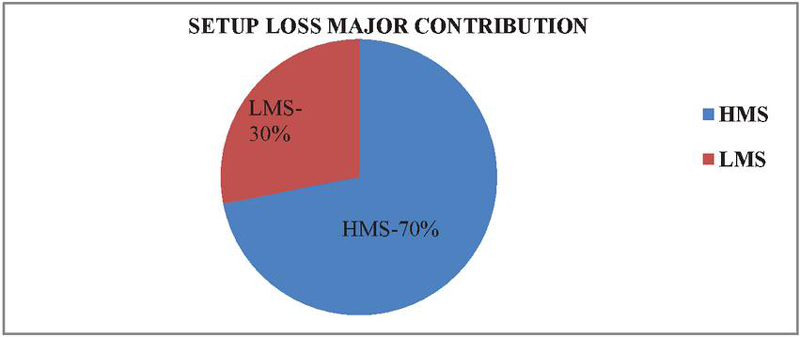
Figure 3 Reduction of setup loss.
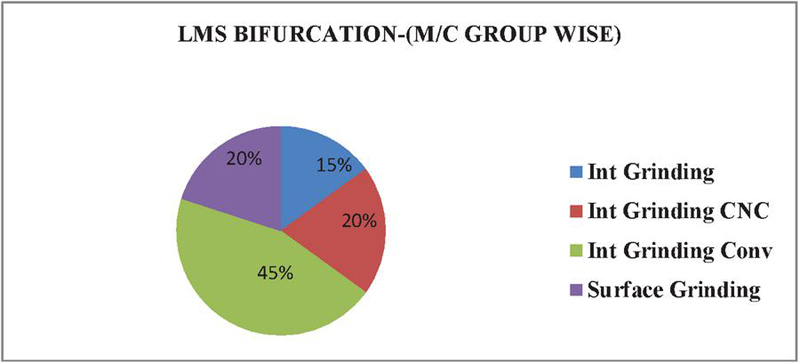
Figure 4 Reduction of setup loss.
After studying this, the present problem is set up time high on internal grinding machine (conventional) i.e. (30 minutes/setup).
(a) Why-Why Analysis for setup loss: – There are two shops, namely LMS (light machine shop) and HMS (heavy machine shop). The LMS section is further bifurcated into subgroups, namely grinding, turning, hobbing, shaving, and drilling. After studying the bifurcation by the team members, it was concluded that setup loss was occurring in the grinding section. Now the grinding section was further bifurcated into four sub-sections, namely internal grinding, internal grinding CNC, internal grinding (conventional), and surface grinding. Out of all these sub-sections, internal grinding (conventional) was taking the most setup time. To find out the root cause, a why-why analysis is used. The why-why analysis tool is an excellent tool to use during activity analysis. It helps to identify the non-value-added steps within the current procedure and guide the worker towards eliminating them. The present problem status for setup loss was to reduce the setup time on the internal grinding machine (conventional). So by using why-why analysis, the root cause behind the problem is identified.
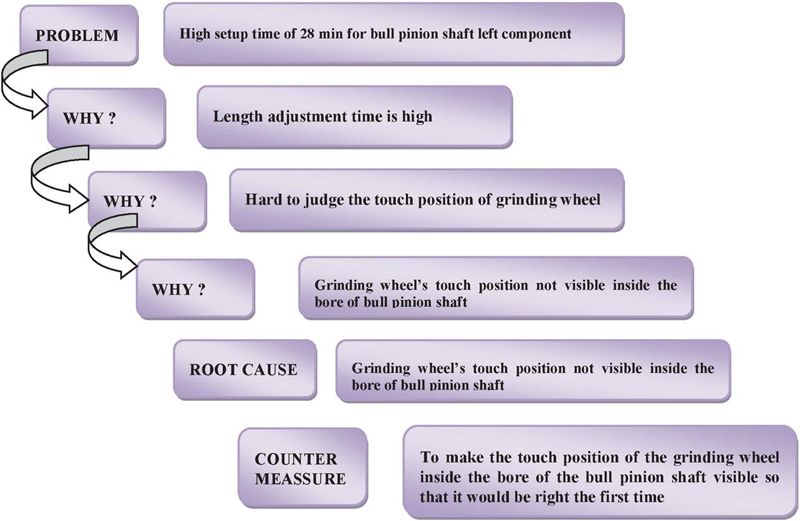
Figure 5 Why-Why Analysis for setup loss.
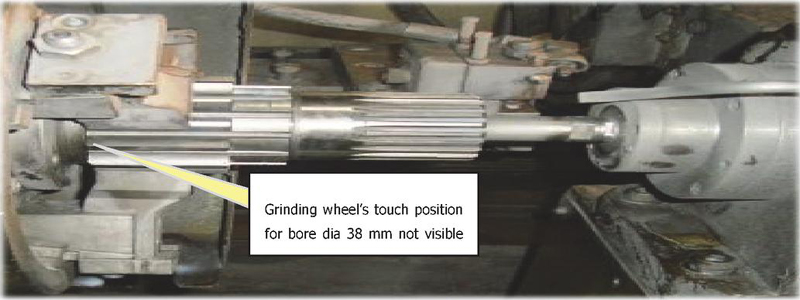
Figure 6 Position of grinding wheel and bull pinion shaft.
After the application of the why-why analysis, the root cause identified was the grinding wheel’s touch position not being visible inside the bore of the bull pinion shaft. So in order to eliminate the problem, the Kaizen hypothesis was proposed. The Kaizen hypothesis was to make the touch position of the grinding wheel inside the bore of the bull pinion shaft visible so that it would be right the first time. Now the evaluation takes place for the validation of the Kaizen hypothesis. For this purpose, kaizen hypotheses were implemented in the concerned department and thus checked for feasibility through the results obtained and also through before and after comparison.
Table 3 Selection of the Kaizen hypotheses
| Kaizen Hypotheses | Evaluation | Remarks |
| To make the touch position of the grinding wheel inside the bore of the bull pinion shaft visible so that it would be right the first time. | Kaizen hypotheses were implemented in the concerned department and thus checked for feasibility through the results obtained and also through before and after comparison. | Valid |
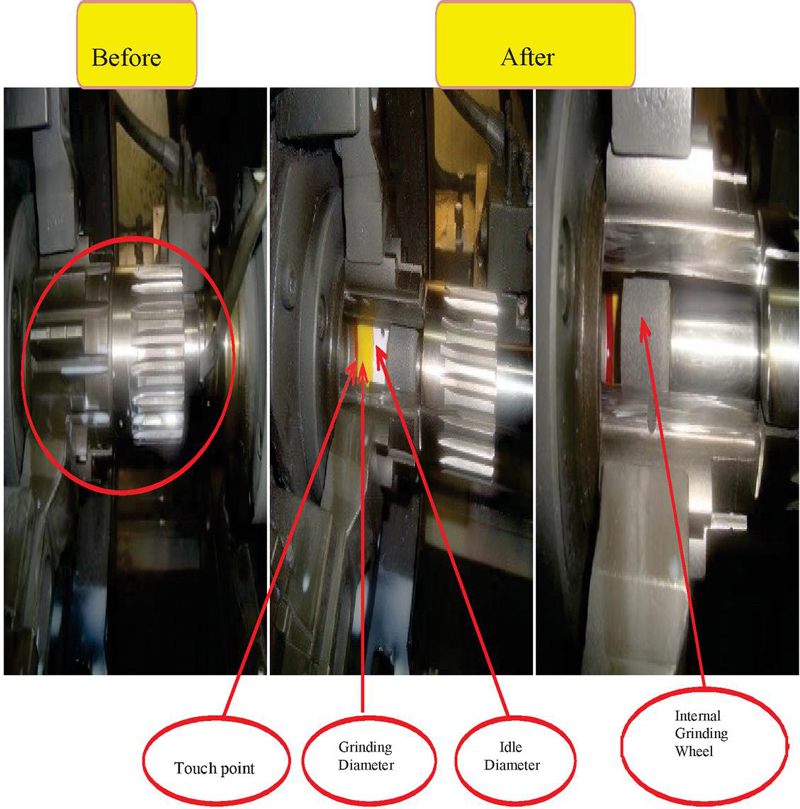
Figure 7 Before-after comparison (counter measure implementation).
(b) Challenges faced by the kaizen team to reduce the setup time are:
(1) Complexity of equipment
(2) Skill dependency
(3) Equipment downtime
(4) Changeover procedure
(5) Tool and Fixture
(6) Inventory Management
These challenges were overcome by involves the strategies such as standardizing setups, investing in automation and advance machinery, improving training and skill development and adopting lean manufacturing principles.
(c) Saving Achieved after reducing setup loss
Tangible Benefit: –
Reducing the setup loss contributes to an increase of overall productivity by following ways: –
• Increased Availability
• Improved Performance
• Enhanced Quality
• Reduce Downtime
• Increased Efficiency
Intangible Benefit: –
• Faster delivery of the components
• Increase the morale of the operators.

Figure 8 Result for setup time loss
5 Result Obtained for Setup Time Loss
Figure 8 highlights the total reduction in set up time after the implementation of kaizen hypothesis. The setup time on internal grinding machine (conv.) was 28 min/setup before implementation of kaizen hypothesis. Now it is reduced up to 80% by implementing the kaizen hypothesis i.e. To make the touch position of the grinding wheel inside the bore of bull pinion shaft visible so that it will be first time right.
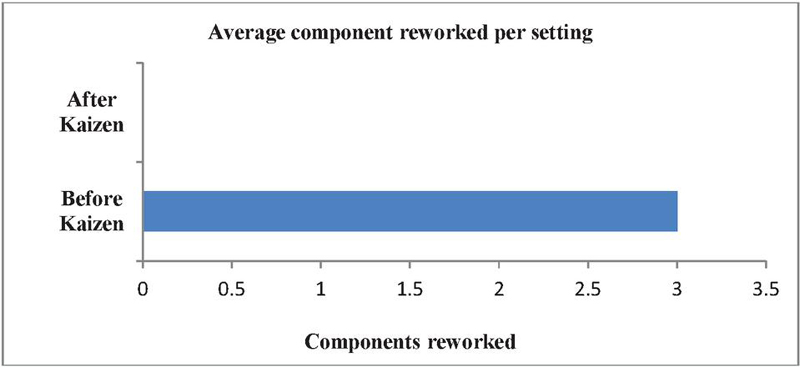
Figure 9 Result for Average component reworked.
The Figure 9 highlights the decrease in average component reworked after the implementation of kaizen hypothesis. Before implementation the average components reworked per setting was 3 components and after implementation it decreases up to zero. i.e. 100% reduction.
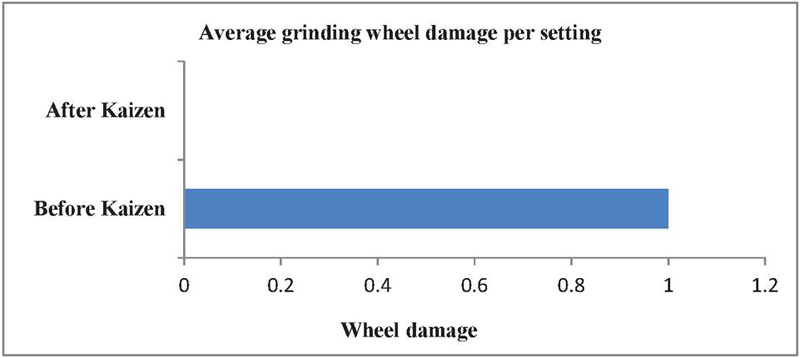
Figure 10 Result for Average grinding wheel damage.
The Figure 10 highlights the decrease in average grinding wheel damage per setting after the implementation of kaizen hypothesis. Before implementation the average grinding wheel damage per setting was 1 component and after implementation it decreases up to zero. i.e. 100% reduction.
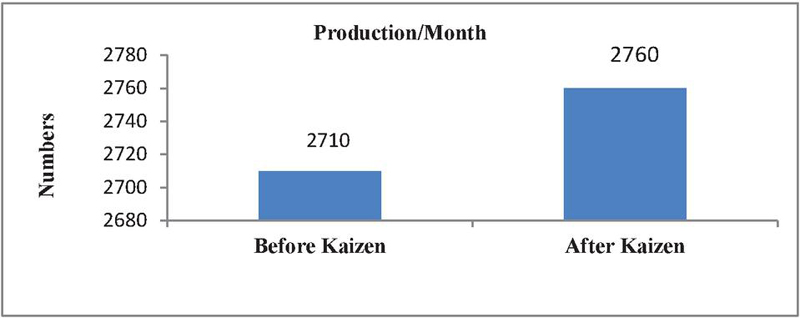
Figure 11 Results for production/month.
The Figure 11 highlights the increase in production capacity/month by reducing the setup time loss after the implementation of kaizen hypothesis. Before implementation, the production capacity was 2710 Units/month and after implementation it is increased up to 2760 Units/month i.e. increased up to 50 components/month. With the increase in production capacity hence increase the production.
5.1 Overall Saving Achieved
Table 4 Total saving per annum
| Overall Saving | |
| No. of components increased per month | 50 |
| Time saving per month | 50 6 (Avg cycle time) 300 mins or 5 hrs |
| Time saving per annum | 60 hrs/annum |
| Cost of machine per hour | Rs 371 |
| Saving per annum | 60 371 22,260 |
| No of wheel saved per year | 156 (Avg one wheel damaged per setting) |
| Annual saving | 156 101(Cost/wheel) Rs. 15756 |
| Total saving per annum | 15,756 22,260 Rs. 38,016 |
5.2 Role of Employee Training and Management
Employee training and management play crucial role in the reduction of setup time in several ways: –
(1) Skill development
(2) Standardization
(3) Cross training
(4) Performance monitoring
(5) Continuous improvement
The team members working for setup time reduction were involved by implement different kaizen ideas and check them for validation in concerned department or by using before-after comparison.
6 Conclusion
This study evaluates the extent of lean adoption in the Indian manufacturing organization using Kaizen analysis and then looks at operational effectiveness. An instrument designed specifically for this purpose is used to collect data, together with worker surveys and interviews with experts in the subject. The study provides evidence to support the overall conclusion that implementing lean practices reduces setup time loss from 28 minutes to 6 minutes per setting, average components reworked to zero, grinding wheel damage to zero, production capacity increased from 2710 to 2760 components per month, and total savings of Rs 38,016 per year. Future initiatives to optimize the setup time may include:
(1) Advanced Automation
(2) Predictive Maintenance
(3) Digital Twins
(4) Real-time Monitoring
(5) Collaborative Robots
By using these future initiatives and technologies, organization can continue to optimize setup time, enhanced operational efficiency and remain competitive in the manufacturing landscape.
References
[1] M. A. Habib, R. Rizvan, and S. Ahmed, “Implementing lean manufacturing for improvement of operational performance in a labeling and packaging plant: A case study in Bangladesh,” Results Eng., vol. 17, Mar. 2023, doi: 10.1016/j.rineng.2022.100818.
[2] I. T. B. Widiwati, S. D. Liman, and F. Nurprihatin, “The implementation of Lean Six Sigma approach to minimize waste at a food manufacturing industry,” J. Eng. Res., Feb. 2024, doi: 10.1016/j.jer.2024.01.022.
[3] M. G. Maarof and F. Mahmud, “A Review of Contributing Factors and Challenges in Implementing Kaizen in Small and Medium Enterprises,” Procedia Econ. Financ., vol. 35, pp. 522–531, 2016, doi: 10.1016/s2212-5671(16)00065-4.
[4] S. Gupta and S. K. Jain, “A literature review of lean manufacturing,” Int. J. Manag. Sci. Eng. Manag., vol. 8, no. 4, pp. 241–249, 2013, doi: 10.1080/17509653.2013.825074.
[5] S. V. Buer, M. Semini, J. O. Strandhagen, and F. Sgarbossa, “The complementary effect of lean manufacturing and digitalisation on operational performance,” Int. J. Prod. Res., vol. 59, no. 7, pp. 1976–1992, 2021, doi: 10.1080/00207543.2020.1790684.
[6] S. J. Pavnaskar, J. K. Gershenson, and A. B. Jambekar, “Classification scheme for lean manufacturing tools,” Int. J. Prod. Res., vol. 41, no. 13, pp. 3075–3090, Sep. 2003, doi: 10.1080/0020754021000049817.
[7] S. G. Gebeyehu, M. Abebe, and A. Gochel, “Production lead time improvement through lean manufacturing,” Cogent Eng., vol. 9, no. 1, 2022, doi: 10.1080/23311916.2022.2034255.
[8] M. Godinho Filho, G. M. D. Ganga, and A. Gunasekaran, “Lean manufacturing in Brazilian small and medium enterprises: implementation and effect on performance,” Int. J. Prod. Res., vol. 54, no. 24, pp. 7523–7545, Dec. 2016, doi: 10.1080/00207543.2016.1201606.
[9] P. J. Gollan, S. Kalfa, R. Agarwal, R. Green, and K. Randhawa, “Lean manufacturing as a high-performance work system: The case of Cochlear,” Int. J. Prod. Res., vol. 52, no. 21, pp. 6434–6447, Nov. 2014, doi: 10.1080/00207543.2014.940430.
[10] E. Drohomeretski, S. E. Gouvea Da Costa, E. Pinheiro De Lima, and P. A. D. R. Garbuio, “Lean, six sigma and lean six sigma: An analysis based on operations strategy,” Int. J. Prod. Res., vol. 52, no. 3, pp. 804–824, Feb. 2014, doi: 10.1080/00207543.2013.842015.
[11] A. Bellisario and A. Pavlov, “Performance management practices in lean manufacturing organizations: a systematic review of research evidence,” Prod. Plan. Control, vol. 29, no. 5, pp. 367–385, Apr. 2018, doi: 10.1080/09537287.2018.1432909.
[12] G. L. Hodge, K. Goforth Ross, J. A. Joines, and K. Thoney, “Adapting lean manufacturing principles to the textile industry,” Prod. Plan. Control, vol. 22, no. 3, pp. 237–247, Apr. 2011, doi: 10.1080/09537287.2010.498577.
[13] M. Ewnetu and Y. Gzate, “Assembly operation productivity improvement for garment production industry through the integration of lean and work-study, a case study on Bahir Dar textile share company in garment, Bahir Dar, Ethiopia,” Heliyon, vol. 9, no. 7, Jul. 2023, doi: 10.1016/j.heliyon.2023.e17917.
[14] V. Tripathi et al., “An innovative agile model of smart lean–green approach for sustainability enhancement in industry 4.0,” J. Open Innov. Technol. Mark. Complex., vol. 7, no. 4, Dec. 2021, doi: 10.3390/joitmc7040215.
[15] M. Hossain and G. Purdy, “Manufacturing Letters Integration of Industry 4.0 into Lean Production systems: A systematic literature review-NC-ND license (https://creativecommons.org/licenses/by-nc-nd/4.0) Peer-review under responsibility of the Scientific Committee of the NAMRI/SME,” 2023, [Online]. Available: www.sciencedirect.com.
[16] A. J. Naeemah and K. Y. Wong, “Sustainability metrics and a hybrid decision-making model for selecting lean manufacturing tools,” Resour. Environ. Sustain., vol. 13, Sep. 2023, doi: 10.1016/j.resenv.2023.10 0120.
Biographies

Amit Surya is a Ph.D. research scholar in industrial and production engineering department at National Institute of Technology, Jalandhar, Punjab, India. He has completed his Master of Technology in Production Engineering from Sant Longowal Institute of Technology, Sungrur, Punjab (India). He has completed his Bachelor of Technology in Mechanical Engineering from Punjab Technical University, Jalandhar. He has about 7 years of teaching experience. His research areas include, TPM, TQM, lean-six sigma.

Rakesh Kumar is a Associate Professor in industrial and production engineering department at National Institute of Technology, Jalandhar, Punjab, India. He has completed his Ph.D. in Mechanical and Industrial Engineering from Indian Institute of Technology, Roorkee. He has completed his Masters in Production Engineering from Punjab University, Chandigarh. He has completed his Master of Business Administration in Human Resource Management from Punjab Technical University, Jalandhar. He has completed his Bachelor of Engineering in Mechanical and Production Engineering from Annamalai University Tamil Nadu.

Rajeev Trehan is a Associate Professor in industrial and production engineering department at National Institute of Technology, Jalandhar, Punjab, India. He has completed his Ph.D. in Industrial Engineering from Dr. B.R. Ambedkar National Institute of Technology, Jalandhar. He has completed his Master of Technology in Industrial Engineering from Dr. B.R. Ambedkar National Institute of Technology, Jalandhar. He has completed his Bachelor of Technology in Mechanical Engineering from Dr. B.R. Ambedkar Regional Engineering College, Jalandhar.
Journal of Graphic Era University, Vol. 12_1, 125–146.
doi: 10.13052/jgeu0975-1416.1218
© 2024 River Publishers