Building the Fatigue Curve Fuzzy Intervals by the Censored Information and Tomography Images
Irina V. Gadolina1,* and Maidanov Igor Sergeevich2
1IMASH RAS, Moscow, Russia
2JSC ONPP Technologiya, Obninsk, Russia
E-mail: gadolina@mail.ru; i.caidanov@yandex.ru
*Corresponding Author
Received 15 January 2024; Accepted 31 March 2024 Publication XX XXXXXX XXXX
Abstract
Fatigue curves of materials are very important and useful in engineering practice. A problem in the application of fuzzy set theory arises from the availability of qualitative (non-numerical), imprecise, and incomplete information. Such information is often obtained from fatigue test data. We use computed tomography (CT) to study the extent of damage to censored samples. Censored samples are samples that were excluded from testing when they reached base test criteria. A fuzzy regression model was developed taking into account linguistic variables. Linguistic variables determine the status of the samples (censored or damaged). Considering the fuzzy dependent variable in the regression model, the coefficients of the regression equation were also transformed into fuzzy variables. The fuzzy dependent variable is the time before the destruction of the censored sample. After examining the images of the defects, the degree of damage is estimated using expert judgment. The model uses the fuzzy method, from different from the classical statistical interval for a given stress amplitude on the fatigue curve, to estimate the probabilistic service life interval. To illustrate the construction of a fuzzy interval, a fuzzy fatigue curve of a polymer composite with a fuzzy interval is shown.
Keywords: Fatigue curve, censored samples, fuzzy regression, computer tomography, polymer composite materials.
1 Introduction
In reliability problems, it is important to have information about the fatigue curves of materials and parts. The fatigue curve shows how many cycles on average a material or part can withstand at a known amplitude of cyclic stresses (see, for example, [1]). In the modern industrial scenario, decision makers have to make decisions to achieve various conflicting goals under conditions of uncertainty. Among them is the problem of constructing a fatigue curve based on data that includes censored observations. The latter definition implies information about testing a specimen for fatigue, but which did not fail during the test period upon reaching the test base, namely the limiting number of test cycles. The test base is set before the start of the tests and is usually 2e6 or 1e7. In recent years, due to the advent of ultrasonic machines, the base has increased significantly (5e8 and more). The task of taking into account information about a censored (i.e., not destroyed at the end of the test) sample when constructing a fatigue curve is directly related to the concept of linguistic (non-numerical) variables. This is because there are two categories of samples: those that broke and those that were censored.
In comparative assessment of material quality and service life assessment, fatigue curves play an important role. They are also important when applying fatigue damage accumulation hypotheses. Fatigue testing is known to be expensive and require a long research time. Therefore, after passing a given test base, samples are usually removed from the testing machine and, at best, sent for storage. In our case, we propose to examine defects to extract additional useful information from them.
Regression analysis is most often used in constructing fatigue curves, and most often only uses information about broken specimens. This does not appear to be justified since information about censored samples is also important for evaluation. This information indicates whether the sample survived to reach the test base.
In [2], the problem of using mathematical methods for assessing single-censored samples obtained during fatigue testing of polymer composite materials (PCM) samples is considered. Once censored refers to those cases where all censorings are equal. In [3], the problem of assessing the quality of PCM is analyzed; the author of [4] analyzed the problem of assessing the quality of PCM for mixed data with censoring on the right and left sides. In [5], the authors consider engine position sensors in urban control systems as a means of air traffic monitoring.
Due to the inherent variability of PCM materials, variability increases when studying composite materials. Even in static tests, these materials show significant differences in their performance. This problem is further exacerbated in fatigue research. The slope coefficient m of the fatigue curve for composite materials reaches large values, m 12…25 for composites. In this case, m 5…10 is typical for metals. The fatigue curves “flatten out”, i.e. a small change in voltage amplitude leads to a large change in the number of cycles. The cloud of points obtained by constructing the fatigue curves of composite materials (see also Figure 1) is the basis for some researchers to claim that “composite materials do not have fatigue.”
When PCM products are destroyed in operation, a transition from microscopic to macroscopic defects occurs. The most common defect in PCM is porosity. The causes of pores depend on production and operating conditions and can vary greatly. In [6], the problem of ensuring the performance of wind turbines is considered. To achieve this, it is important to have tools that guarantee a high reliability rating. One of the reliability parameters is the refined construction of the fatigue curve [6], which must be constructed correctly (taking into account information about censored samples).
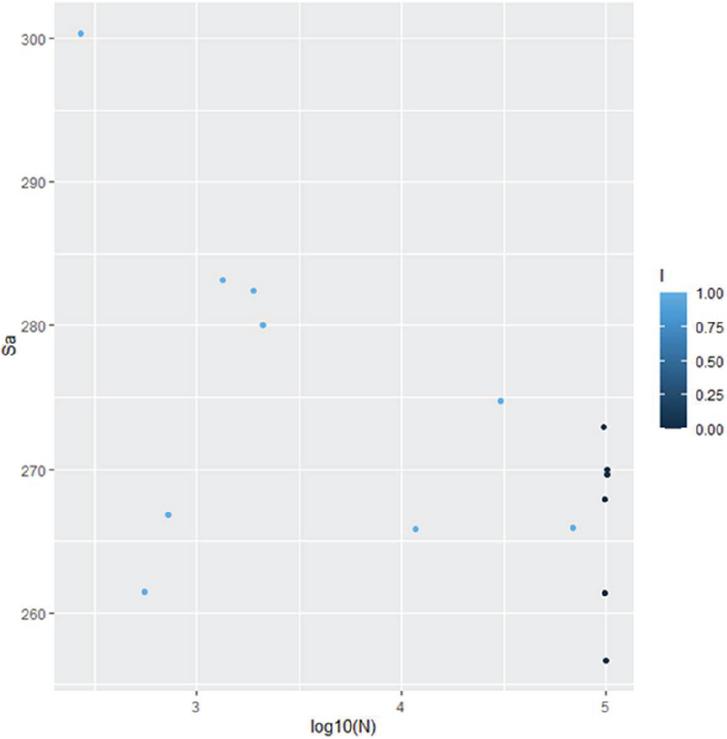
Figure 1 The fatigue data for PCM specimens testing. Light dots are failures, dark dots are censoring.
There is a large amount of literature devoted to the diagnosis, collection and study of information about defects in composite materials. This is due to the fact that the strength of PC is of great practical importance. The most modern method for studying strength is the ultrasound method (see, for example, [7]). Computed tomography examinations are also becoming increasingly common. Tomographic studies are of great importance for both monitoring and diagnosing defects in the production and operation of composites.
In [8], the authors systematized the main types of production and operational defects of composite materials. Work [8] describes the main types of micro-, mini- and macrodefects in PCM. Tomography [8] can be used to create a three-dimensional model of an object. Unlike traditional methods, this model estimates the integral porosity of matrices, their size and spatial distribution.
2 Methodology and Materials of the Experiment
We studied a composite material, the matrix of which was the Inconel 625 nickel alloy, and the reinforcing element was WC–W2C particles. On the testing base of 10e5 cycles, the fatigue curve (Figure 1) for miniature specimens (1 10 mm cross-section) taken from one batch was built using the INSTRON testing machine. The loading mode was compression. Total number of specimens tested on fatigue was 17. Among them, 9 were broken not reaching the testing base. We call them the censored ones. It is evident from Figure 1, that the scatter in the experiment is large. There is also a high percentage of censored samples. A special methodology with a fuzzy regression model based on processing the tomographic images was developed to overcome the problem of uncertainty with censorship and scatter. In works [9–12] examples of tomography methodology in varied scientific fields were described.
Fuzzy regression model
We developed a fuzzy regression model to account for uncertainty in constructing fatigue curves based on censoring results. The prediction study for censored samples is consistent with the study of damage on censored samples. This information was recorded on CT scans. We hypothesized that damage was caused by the development of micro defects under stress and was a measure of the deterioration of the properties of the censored image. The experts were asked to assign a score (R 0, 1 …10). These scores were used in the model to develop a fuzzy regression model. The fuzzy regression model included fuzzy outputs and fuzzy parameters of the equation. The inputs were fuzzy. This type of model allows you to set limits on the variation of a random outcome variable. They are similar to confidence intervals used in statistics but have their characteristics and different ranges.
Several authors previously used fuzzy regression models in solving various profile problems. In [13], a nonlinear fuzzy matrix was used; in [14], a fuzzy detector of the censored distribution of the maximum average level was developed – a unique frequency detector of false positives; in [15], a fuzzy regression model was proposed for assessing the functional dependence between dependent and independent variables. In [16], a fuzzy logic controller was built using the MATLAB program with the Fuzzy Logic Toolbox package installed. The controller is built based on experience with ship systems and corrosion processes. The specified controller provides the ability to determine the reliability of air pistols. For this, input signals are used in the form of a known number of shots from a gun, considering of corrosion of equipment and operating conditions of equipment (number of flight hours). When only censored data is presented, work [17] proposes to use fuzzy probability theory to take into account uncertainty and preliminary knowledge about the process when estimating parameters [18], learning rules are proposed to maximize the likelihood of a classifier [19] based on censored data. In [20], it was proposed to subject multivariate time series data to exploratory analysis. This required the use of specialized coding methods.
The paper [20] dealt with the problem of multiple fuzzy linear regression which is applied to the analysis of management processes of agricultural production. The author of [20] used results of observations of the dependent variable , , and values of independent crisp variables , ; (generally). The work [20] searched for the resulting variable in the form of equation in a fuzzy multiple linear regression form:
| (1) |
where – are the crisp, and y – are fuzzy numbers. The group of parameters (fuzzy ones) , was searched based on several conditions. The system was solved by the linear programming method with applying several varied values of the reliability fuzzy threshold [20].
3 Method
We developed a fuzzy regression model to consider uncertainty when constructing a fatigue curve with censored outcomes. The task of estimation on censored samples is alignment with the study of damage to censored samples. This information is recorded on computed tomography images. We assumed that damage is due to the development of micro defects under reportable loading and is a measure of the degradation of the properties of censored samples. We asked the experts to assign ratings (R 0, 1 …10) to censored samples as a measure of their damage based on the analysis of visual tomographic images. The rating values were used in the model, and a fuzzy regression modelling model was developed. The fuzzy regression model included fuzzy outputs and fuzzy equation parameters, but crisp inputs. A model of this type allows you to set limits on the change of random variables. They are somehow similar to the confidence intervals used in statistics but have their characteristics and different scopes.
A few authors previously applied the fuzzy regression model by applying problems of various profiles. The paper [13] deals with non-linear fuzzy matrices. In [14], a distributed fuzzy detector of the maximum average level with censorings is developed – a detector of a unique frequency of false positives. To evaluate functional relationships between dependent and independent variables in a fuzzy environment a fuzzy regression model was proposed We developed a fuzzy regression model to account for uncertainty in constructing fatigue curves that included censored results. The work on the prediction of censored samples overlaps with research on damage to censored samples. This information was recorded on CT images. We hypothesized that damage was caused by the development of micro defects under the influence of recorded loads and was a measure of property deterioration. of the censored sample. The experts were asked to evaluate the censored samples as a measure of damage (R 0, 1 …10) based on the analysis of atomic images. The resulting estimates were used in the model, and a fuzzy regression modeling model was developed. The fuzzy regression model contained fuzzy outputs and fuzzy parameters of the equations, but the inputs were clear. In models of this type, you can set restrictions on changes in random variables. They are similar to confidence intervals used in statistics, but they have their characteristics and different intervals.
Many authors have previously used fuzzy regression models to solve various profile problems. To assess the functional relationships between dependent and independent variables in a fuzzy environment, fuzzy regression was proposed in the model [15]; in [16], a fuzzy logic controller was developed in the MATLAB program using the fuzzy logic toolbox package. The controllers are built based on experience in working with ship systems and their corrosion processes. The specified controller provides the ability to determine the reliability of an aircraft gun using known input signals given the operating conditions of the equipment (number of flight hours), number of rounds fired ears, and corrosion states of equipment. In [17], the authors propose to use fuzzy probability theory to account for process uncertainty and prior knowledge when estimating parameters when only censored data is presented. In [18], they propose learning rules by maximizing the classifier probability. Thus, they extend their method to interval censored data and propose to use upper and lower probability bounds to improve the rule base; the authors of [19] propose an exploratory analysis method for multivariate censored time series that requires the use of special coding methods.
The paper [20] stated the problem of multiple fuzzy linear regression which is applied to the analysis of agricultural management processes of production. The author of [20] used n results of observations of the dependent variable , , and values of independent crisp variables , ; (generally). [20] searched the resulting variable in the form of a fuzzy multiple linear regression equation:
| (2) |
where – are the crisp, and y – are fuzzy functions.
The group of parameters (fuzzy ones) , was searched based on several conditions. The system was solved by the linear programming method with applying several values of the reliability threshold [20].
In Figure 2 the triangular fuzzy number is shown.
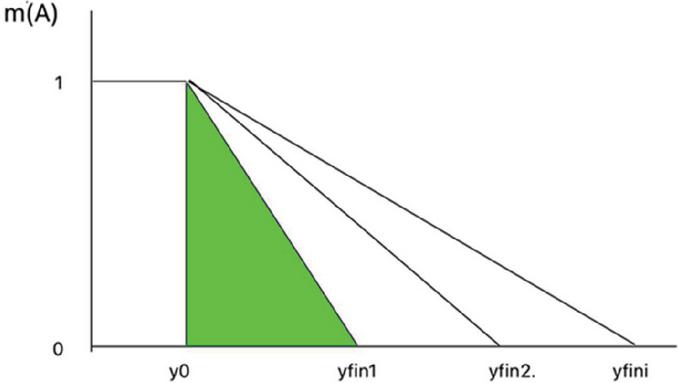
Figure 2 Fuzzy one-sided triangular number m(A) (the square under triangular fuzzy number shaded green for the hypothetical sample 1).
The equation of triangular number is written in the form (3):
| (3) |
where – is the censoring threshold. It corresponds to the logarithm of testing base . Here and .
Obtained based on fuzzy parameters the fuzzy sets should contain the observed values with a degree of confidence not less than a particular level (. Since infinite durability is not noticed for composite samples even under the condition of testing with ultrasonic frequencies [22], in expression (6) the infinity is replaced by a finite number of N 10^y cycles, namely:
| (4) |
where , are the fuzzy number in the known interval.
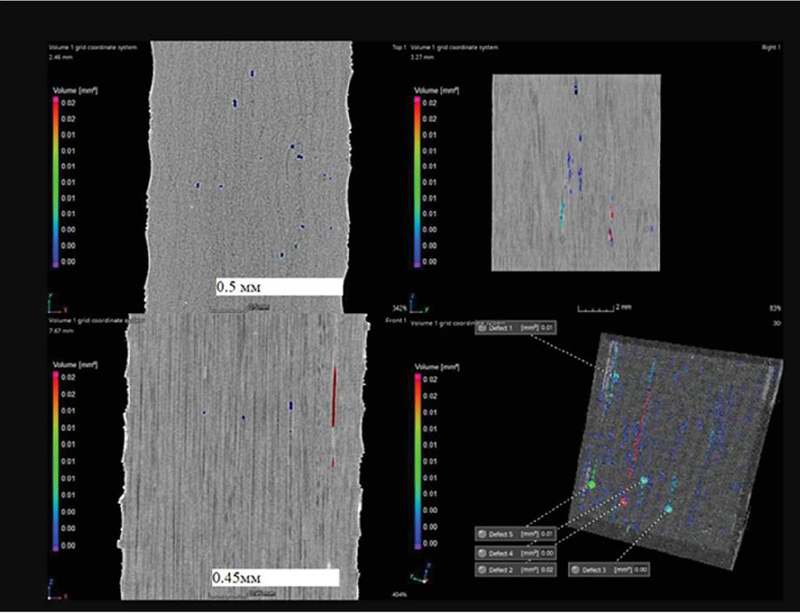
Figure 3 Relatively “satisfactory” censored sample No. 9.
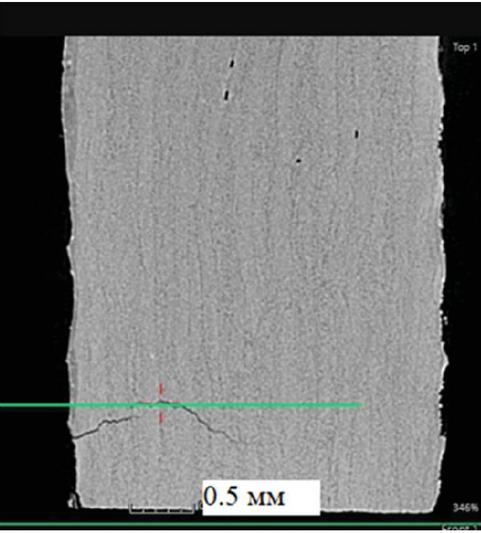
Figure 4 “Uncomplimentary” censored specimen No. 16. A transverse crack was originated. Expert rating is “0”. The state of the specimen is life-threatening.
4 The Results of Experiments
The purpose of this article is to incorporate the relative damage data obtained from censored samples into the definition of a fatigue curve. To achieve this, a fracture study was carried out on a censored sample using a WG v|tome| m300 industrial tomograph. The membership function (3) was supplemented with information obtained from the processing of digital images obtained from an industrial tomograph. Figures 3 and 4 show tomographic images of some of the censored samples. They were rated by experts for the degree of visual damage. Cracks are the most dangerous opportunity in terms of destruction potential. Therefore, when assigning ratings, Great caution. The development of micropores does not necessarily lead to the development of macropores [18].
Table 1 shows a summary assessment by experts of all studied samples.
Figures 3 and 4 show images of the cross sections of the samples on which calculations were carried out. Figure 4 shows a two-dimensional cross section of the sample 9. Porosity analysis is completed. The color scale indicates the size of the pores. Not all pores turn into macro defects [18]. The volume painted in red is 0.02 mm 3. 3D model is shown at the bottom right in its depth. The intertwined sacrificial (technical) layer is visible. Expert assessment of sample 9-“6”. Figure 4 shows sample No. 16 with the censorship “non-complementary”. Transverse cracks are visible. The expert’s assessment is “0”. The condition of sample No. 16 is critical. However, it should be noted that some defects could have arisen during the manufacturing stage of the sample.
Table 1 The main detected defects and ratings for censored samples rendering to the experts
| Censored sample index | 9 | 14 | 15 | 16 | 18 | 20 | 21 | 22 |
| Main defect | Pores | Transverse crack | Pores and inclusion in the form of a hair | Transverse crack, delamination and metallic inclusion | Layering | Pores | Big pores | Multiple layering |
| Damage rating (according to experts) | 6 | 0 | 3 …4 | 0 | 3 | 2 | 1 | 1 |
5 Construction of Fuzzy Limits for Fatigue Curve
Previously [23] proposed a fuzzy parameter estimation model and a program for a fuzzy linear regression (FLR) model where the independent variables and responses were fuzzy. In the problem we were solving, the independent variables were crisp (logarithms of stress amplitude log_Sa), the responses were partially crisp (for failures – logarithms of time between failures log_N) and partially fuzzy (time to censoring). To construct a regression line and fuzzy confidence regions, the FLS method from the FUZZYREG package, written specifically for the R programming environment [23] with the construction of a confidence region, was used for it. This package was used for solving our problem of censored samples of composite material.
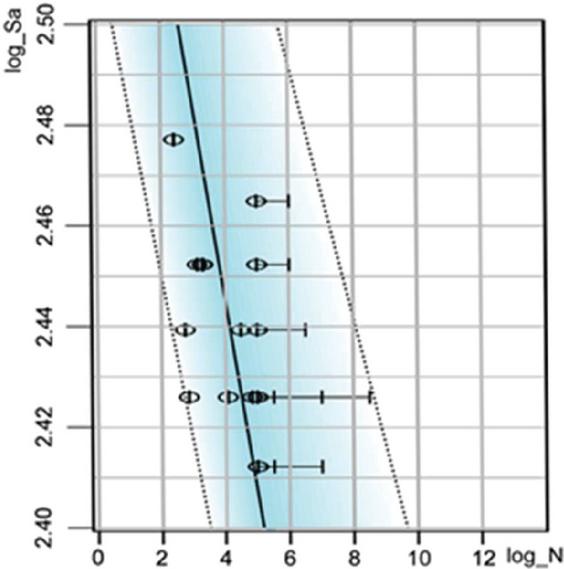
Figure 5 A fuzzy regression domain constructed taking into account ratings obtained from tomography images of censored samples.
Figure 5 shows the fatigue curve of composite samples with confidence limits (dashed line). Sample failures are indicated by ovals, horizontal segments are fuzzy numbers corresponding to censoring.
To find fuzzy coefficients m and C of fuzzy regression Equation (4, 5), we use the least squares method to minimize the deviation:
| (5) |
where y are partly the fuzzy responses for crisp factors x evaluated by Equations (4, 5) and are the defuzzificated (the closest) crisp value of y.
The ratings obtained based on expert assessments on tomographic images were used to evaluate the right boundaries of triangular fuzzy numbers (Figure 2). In Table 2 the most probable values for N+ (Equation (3)) of triangular number are shown.
Table 2 Upper bound of the triangular fuzzy number y (corresponding to the maximum possible durability for censored samples with rating R)
| R | 0 | 1 | 2 | 3 | 4 | 5 | 6 | 7 | 8 | 9 | 10 |
| 5.5 | 6 | 6.5 | 7 | 7.5 | 8 | 8.5 | 9 | 9.5 | 10 | 10.5 |
While assigning the data from literature were used, for example [22].
6 Conclusions
• For the first time, a method has been developed that uses modern physical research methods (computed tomography studies), allowing for more accurate assessment of fatigue curves in cases of censoring and high variability of data.
• A fuzzy regression model has been developed that reflects additional information on the presence of censoring (dropout) and the state of the censored sample.
• Non-clear endurance limits (similar to confidence intervals) were assessed for a PCM fatigue test sample.
References
[1] Kumar, A., Pant, S., Ram, M., and Kumar, A. (2023). Evolutionary Algorithm-based Approach for Multi-Objective Optimization of a Complex Reliability System. Journal of Graphic Era University, 11(02), 133–152. https://doi.org/10.13052/jgeu0975-1416.1122.
[2] Berezin, A. V. et al. (2021). Quality control of composites. IOP Conf. Ser.: Mater. Sci. Eng. 1023 012005. DOI: 10.1088/1757-899X/1023/1/ 012005.
[3] Gadolina, I. V. et al. (2021) Method censored samples consideration in composite fatigue testing. J. Phys.: Conf. Ser. 1990 012020. DOI: 10.1088/1742-6596/1990/1/012020.
[4] Ghaida, A., Baklizi, A. (2022). Prediction of future failures in the log-logistic distribution based on hybrid censored data Int J Syst Assur Eng Manag. 13, 1598–1606. https://doi.org/10.1007/s13198-021-01510-3.
[5] Lee, T. et al (2021). Position Fault Detection for UAM Motor with Seamless Transition IEEE Access, 9, 168042-168051. DOI: 10.1109/ ACCESS.2021.3134911.
[6] Bisht, P., Sharma, K. (2023). Drag Reduction of Wind Turbine Blade to Enhance Aerodynamic Performance: A CFD Study. Journal of Graphic Era University, 11(01), 35–44. https://doi.org/10.13052/jgeu0975-1416.1113.
[7] Chulkov, D. I. et al. (2020). A study of physical and mechanical characteristics of polymer Composite materials by ultrasonic technique. IOP Conf. Ser.: Mater. Sci. Eng. 934, 012031.
[8] Boychuk, A. S. et al (2020). Ultrasonic control of samples in the process of development and testing of new grades of carbon fiber Electronic scientific journal Proceedings of VIAM.12. (in Russian).
[9] Liang, J. et al (2022). Multi-mineral segmentation of micro-tomographic images using a convolutional neural network Computers & Geoscience. 168 105217, ISSN 0098-3004. https://doi.org/10.1016/j.cageo.105217.
[10] Lyubimova, M., Knyazeva, T. (2014). Processing of tomographic images by means of wavelet analysis Journal of New Medical Technologies. eJournal. 1, 1–4. DOI: https://doi.org/10.12737/4110 (Date of access 29.11.2022).
[11] Lamary, P. et al (2020). X-ray tomographic image post-processing and a new 2D LBM simulation for the determination of the porosity and the static airflow resistivity of an acoustic fibrous material. Applied Acoustics, Elsevier, 169, 107452. https://doi.org/10.1016/j.apacoust.2020.107452.
[12] Ha, S. J. et al. (2020). Parameterization of the representative sizes of microstructural features in rocks using 3D X-ray computed tomographic images Computers & Geosciences. 144, 104590, ISSN 0098-3004. https://doi.org/10.1016/j.cageo.2020.104590.
[13] Zakaria, A. et al. (2023). Computational Mathematics: Solving Dual Fully Fuzzy Nonlinear Matrix Equations Numerically using Broyden’s Method. International Journal of Mathematical, Engineering and Management Sciences. 8, 1, 60–77. https://doi.org/10.33889/IJMEMS.2023.8.1.004.
[14] Gong, S. et al. (2015). Distributed fuzzy maximum-censored mean level detector-constant false alarm rate detector based on voting fuzzy fusion rule IET Radar Sonar Navig. 9, 1055–1062. https://doi.org/10.1049/iet-rsn.2015.0008.
[15] Miin, S. Y., Tzu, S. L. (2002). Fuzzy least-squares linear regression analysis for fuzzy input–output data, Fuzzy Sets and Systems. 126, 3, 389–399. ISSN 0165-0114. https://doi.org/10.1016/S0165-0114(01)00066-5.
[16] Żyluk, A., Kuźma, K., Grzesik, N., Zieja, M., Tomaszewska, J. (2021) Fuzzy Logic in Aircraft Onboard Systems Reliability Evaluation – A New Approach Sensors. 21(23). 7913. https://doi.org/10.3390/s21237913.
[17] Sánchez, L., Couso, I. (2011). Obtaining fuzzy rules from interval-censored data with genetic algorithms and a random sets-based semantic of the linguistic labels Soft Comput. 15, 1945–1957. https://doi.org/10.1007/s00500-010-0627-6.
[18] Kato, M., Takahashi, M. (2013). Evaluation of porosity and its variation in porous materials using microfocus x-ray computed tomography considering the partial volume effect Materials Transactions. 9, 1678–1685.
[19] David, G. G., Mario, C. S., Rolando, P., Bernardo, F. H., Ricardo, Z. S. (2014). Fuzzy reliability analysis with only censored data. Engineering Applications of Artificial Intelligence. 32, 151–159. ISSN 0952-1976. https://doi.org/10.1016/j.engappai.2014.02.012.
[20] Parfenova, V. E. (2019). Fuzzy regression modeling in tasks of management of agrarian production Innovations. 7, 249. DOI: 10.26310/2071-3010.2019.249.7.013. (in Russian).
[21] Zak, Ju. A. (2012). Decision making under conditions of fuzzy and blurred data. Fuzzy technologies. Moscow, URSS, 348 p. ISBN 978-5-397-03451-7. (In Russian).
[22] Wenbin, C. et al. (2020). Very High Cycle Fatigue (VHCF) Characteristics of Carbon Fiber Reinforced Plastics (CFRP) under Ultrasonic Loading Materials. 13, 4, 908. DOI: 10.3390/ma13040908.
[23] Škrabánek P., Martínková N. (2021). Algorithm 1017: fuzzyreg: An R Package for Fitting Fuzzy Regression Models. ACM Trans. Math. Softw. 47, 3, 29 (June 2021), 18. https://doi.org/10.1145/3451389.
Biographies

Irina V. Gadolina is a Senior Research Worker in a Mechanical Engineering Research Institute named after A.A. Bagonravov of the Russian Academy of Science. She graduated from Moscow Higher Technical School named after Bauman with a specialty in “Strength of Materials”. Since then, she has been working on the problem of Metal fatigue. The sphere of her interests includes also the reliability problems and the analysis of random loading processes. Her PhD thesis was concerned with the method of longevity estimation of the machine parts under the impact of random loading. She is a reviewer of various journals and conferences.

Maidanov Igor Sergeevich was born on May 1, 1986. Higher education. Graduated from the Moscow State Engineering University “MAMI”, Moscow by profession as an engineer. Specialty: technology of processing plastics and elastomers. Works at JSC “ONPP “Technology” named after A. G. Romashin” in Obninsk as an engineer. Area of scientific interests: Polymer composite materials, processing of semi-finished products, quality control.
Journal of Graphic Era University, Vol. 12_1, 89–104.
doi: 10.13052/jgeu0975-1416.1216
© 2024 River Publishers