Application of Kaizen Analysis in Automotive Industry: A Case Study
Amit Surya*, Rakesh Kumar and Rajeev Trehan
National Institute of Technology, Jalandhar, India
E-mail: amits.ip.22@nitj.ac.in; sharmark@nitj.ac.in; rtrehan@nitj.ac.in
*Corresponding Author
Received 01 April 2025; Accepted 21 May 2025
The manufacturing sector has grown significantly during the last two to three decades. Because of the intense competition, customers now place a higher priority on price, delivery time, and product quality. This study employs lean methods and methodologies, including root-cause analysis, kaizen ideas, evaluation of kaizen ideas, and before-and-after comparison, to evaluate the operational performance of the organization. It accomplishes this by using kaizen analysis to assess the level of lean implementation in Indian manufacturing companies. A questionnaire was developed for the goal of collecting data, and industry experts were contacted personally and questioned. According to this study, common implementation of lean practices leads to a reduction of 68% in setup loss, 70% in setup time, 17% in energy consumption, 11% in electricity consumption, 51% in lead time, and an increase of 8.5 times in kaizen per team annually.
Keywords: Lean manufacturing, kaizen analysis, overall equipment effectiveness (OEE), root-cause analysis.
Lean philosophy was developed in the early 1950s in the Japanese automobile industry as a result of common sense and the need to enhance production performance by eliminating avoidable losses that were being reported on a daily basis [1]. A practice known as lean manufacturing centres on getting rid of all supply chain non-value adds. After World War II, in the 1950s in Japan, it was created by Taiichi Ohno, a Toyota official. Eliminating process waste and focusing on the demands of the client are the foundations of lean. Increasing productivity and quality while reducing waste are the goals of this management style [2]. Remembering that Lean is applicable throughout the entire organization. Although individual Lean building blocks or components may be tactical and narrowly focused, they work best when used collectively and applied cross-functionally throughout the system. In essence, lean manufacturing is the methodical elimination of waste from all aspects of a company’s activities. Any resource usage or loss that does not instantly lead to the production of the good or service a client requires at the appropriate time is referred to as waste. Such non-value added work can make up more than 90% of a factory’s overall activity in various industrial processes. Making the production move through the system more quickly and predictably is the goal. The goal is to eliminate waste so that labour can earn better pay, business owners can make more money, and customers can receive better quality products [3]. Businesses employ lean manufacturing to cut waste and maximize resource use. In the main, the lean idea was introduced by Toyota’s Japanese manufacturing. Lean principles specify the value of the goods and services based on production flow and consumer demand. Waste development and reduction are constant priorities in the manufacturing business. As a result, the sector constantly works to differentiate between non-value-added activity (NVA) and value-added activity (VA). Non-value added activity (NVA) encompasses a wide range of activities, including excess production inventory, motion, waiting, transportation, and defect process failure [4].
Figure 1 Graphical abstract.
Sustainability, an important component of sustainable development and competitive advantage, is substantially impacted by lean manufacturing tools. The connection between Lean Manufacturing and energy efficiency is considered its “new frontier” [5]. Lean is widely utilized in the interdisciplinary field and is defined differently by academics that have a variety of perspectives on a topic as well as varied goals, thoughts, and proposals [6]. Lean techniques and tools have reportedly aided manufacturing companies in achieving operational excellence, which has enabled them to accomplish both traditional and modern organizational goals like profitability, efficiency, responsiveness, quality, and customer satisfaction [7]. The relationship between lean and operational performance has been extensively studied. For two reasons, the association is being tested in this study. First, it offers a chance to confirm earlier research with new data and metrics. Replication studies have been stressed by researchers for a long time. The evaluation of corporate culture’s moderating role, the study’s main focus, is a critical first step. The majority of lean evaluation studies find that it significantly and favourably affects numerous operational performance measures [8]. In order to prevent station delays, it analyzes the current operation time for assembly line balancing. An assembly line’s cycle time decreased as a result of the use of lean tools [9]. An automobile plant’s cycle time, which includes a lot of non-value-added tasks and labor, is decreased by using lean manufacturing and line balancing techniques. The term “lean manufacturing” was first used to refer to Toyota’s TPS (Toyota production System) quality and efficiency improvement procedures in Womack’s 1990 book “The Machine That Changed the World released.” Lean concepts stress the continuous detection and elimination of waste since they have an impact on manufacturing operations. Lean manufacturing is an integrated process that creates products or provides services with the least amount of buffering costs possible [10]. A strong adoption of lean requires an enterprise-wide management structure that cultivates a culture where people are empowered to address problems and make regular improvements. This is made possible by effective communication, employee involvement, a shared objective, and teamwork [11]. Implementing lean methods will enhance operational performance and marginally improve environmental performance, but when those complimentary approaches are combined, both operational and environmental performance is increased [12]. Giving employees the knowledge and a common style of thinking that will help them minimize waste, create better work processes, and improve connections and streamline supply chain flows is the goal of a lean management approach. It is not to implement Japanese philosophy or use a set of instruments to solve issues mechanically [13]. The incorporation of kaizen (KAI), Gemba (GEM), and 5Whys makes it easier to align lean manufacturing with objectives since it enables businesses to broaden their lean statements to incorporate social components and improve social performance [14]. The application of Lean Manufacturing Tools (LMT) to improve a wide range of business domains in many industries and settings is covered in a large number of publications. For example, kaizen helped Toyota become a global leader in the automobile sector by improving quality in Japan and reducing costs and defects, according to [15]. According to [16], KAI helps an Italian company reduce production costs by 10% and enhance on-time delivery by 70%. KAI is a management philosophy that aims to increase productivity, decrease waste, and enhance quality through employee involvement. Additionally, it fosters a culture of innovation, collaboration, and problem-solving, all of which improve customer satisfaction, cut costs, and boost output [17]. Because it enables continual improvement through small, gradual changes, including all employees, and encouraging cooperation and dedication to reform, KAI is crucial to TQM [18]. This is because KAI has a beneficial impact on the calibre of work and services, and organizational culture is a key factor in its successful implementation, especially when staff members show a dedication to ongoing development [19]. In industrial processes, KAN (Kanban) and POY (Poka-Yoke) increase output and reduce errors in material flows. Together with POY, KAN creates error-proofing systems that obstruct material flow and serves as a visual signalling system that controls manufacturing [20]. The author combined the three management philosophies of Six Sigma, Lean, and Green. Four distinct industries implemented the suggested methodology, and the research findings show encouraging outcomes in terms of lowering water and energy consumption and raising output [21]. Gemba (GEM) is an additional strategy that involves walking manufacturing lines to find areas for on-site improvement and speaking with staff members directly to get personal information [22]. A theory and collection of techniques known as lean thinking are used to provide value and cut waste in any kind of process. Manufacturing is one industry where lean thinking has been used to increase production, quality, delivery, and profitability [23]. Together, LM and sustainability improve manufacturing and increase competitiveness. LM offers a holistic view of sustainability and optimizes processes in terms of cost, time, waste, and quality while taking social and environmental quality into account [24]. Lean implementation guarantees that the environmental, social, and economic aspects of the manufacturing process are appropriately addressed by including elements of lean six sigma, supply chain management, industrial process performance, and sustainability [25].
The paper is structured as: Section 1 summarizes the introduction part, Section 2 summarizes the literature review, Section 3 comprises company profile, Section 4 demonstrated with the case study and Section 5 discusses the results obtained and paper conclude with conclusion and future research directions.
The company ABC (name withheld to protect company privacy) focuses on providing solutions that support mobility, foster rural prosperity, improve urban lifestyles, and boost business productivity. More than 155,000 employees are employed by the Mumbai-based, USD 15.9 billion international firm, which has operations in more than 100 nations. When the business first started operating in 1974, it could produce 5000 tractors annually. With a current capacity of 49,200 tractors per year, the plant now produces eight tractor models with horsepower ranging from 20 to 42. The plant is situated on 97,000 square meters of land and has the capacity to produce all variants. The average age of the 238 machines and pieces of equipment in the plant is 22 to 25 years. Additionally, the facility produces gears and shafts for other plants. The plant has obtained certification for OHSAS 18001:2007, ISO 9001:2008, and ISO 14001:2004.
The company has initiated TPM Practices in 2008 in all the plants. For the TPM implementation, the TPM committee was prepared leading by chairman for performing the desired tasks using the tools like WHY-WHY analysis, FMEA, Kaizen etc. After analyzing the existing condition of plant, the goals are set which are resulted oriented, specific, measurable, and attainable. The corporation set TPM policies, objectives, targets, organizational structure, and necessary procedure so that the goals were obvious to all parties involved in TPM implementation. Data is collected by a survey of employees, discussions with industry experts, and a questionnaire designed specifically for the purpose.
To increase a plant’s overall equipment effectiveness (OEE) and successfully apply TPM in the industry, all eight pillars had to be put into place. These pillars also aid in lowering losses like as yield losses, speed losses, idling and small stoppage losses, and downtime losses. The most potent TPM pillar is Kobetsu Kaizen (KK), also known as targeted improvement, which can address 70–80% of shop floor issues in the sector. Thus, the implementation of kobetsu kaizen (continuous improvement) pillar in the company discussed here in detail.
In order to enhance the overall effectiveness of machinery, processes, and plants, the activities under the Focused Improvement/Kobetsu Kaizen (KK) pillar of TPM seek to improve performance while brutally removing 16 various types of losses. The group decides on and creates strategies for reducing or eliminating the 16 losses, which are thoroughly measured and assessed. The focused improvement pillar activity includes:
• The 16 main losses are defined and understood.
• A systematic strategy for removing or reducing those losses is developed
• an OEE calculation methodology is used
• Making a loss-cost matrix and a loss tree
To overcome the focused improvement or KK (Kobetsu Kaizen) pillar challenges, the pillar team comprising of pillar head and other team members. The team members carried out all the necessary activities along with a structured approach to overcome the losses occurring in KK pillar.
To achieve company’s vision, the pillar representatives laid some strategies. As per these strategies, KMIs, KPIs, KAIs are identified which are shown by Figure 2.
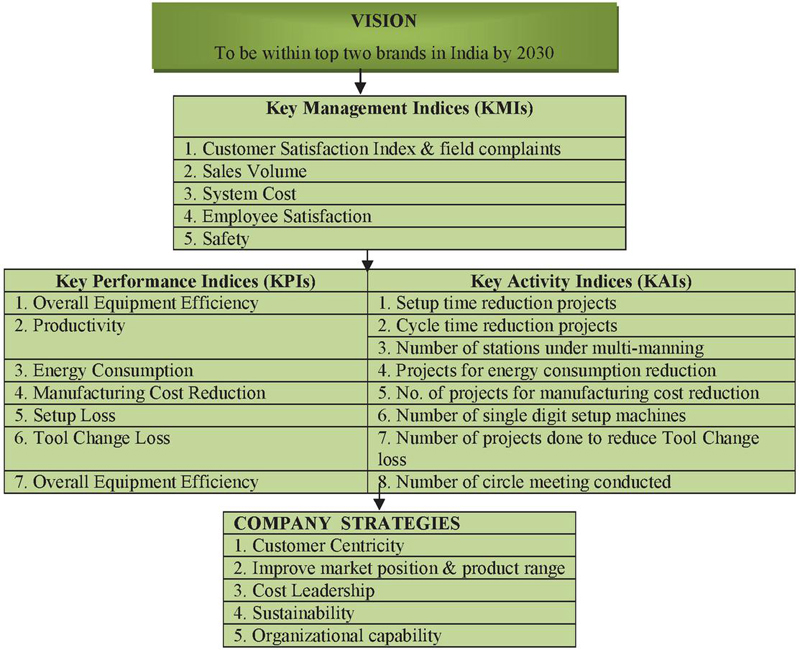
Figure 2 Strategy deployment.
The KK pillar team members along with pillar head prepares master plan (as shown in Table 1) for carrying out activities in a planned manner. All pillar members strictly adhere to this master plan, which contains all the activities necessary to meet the TPM aim of zero losses.
Table 1 Master plan for KK pillar
| Steps | Activity |
| 1 | Data gathering and loss capture on all machines |
| 2 | Create a matrix of loss costs. |
| 3 | Sort losses according to the loss cost matrix. |
| 4 | Goal-setting and the kaizen theme |
| 5 | Outlining a kaizen plan |
| 6 | Kaizen implementation |
| 7 | Tracking of the savings made |
| 8 | Horizontal implementation |
| 9 | The OLE and OPE calculations |
| 10 | An increase in OLE and OPE |
To accomplish the KK pillar aims, a methodical methodology was used to carry out pillar activities. The following is a description of the seven-step method used:
• Gathering and analyzing data
• Determine which machines are essential and use a loss-cost matrix to rank the losses.
• Determine the OEE beforehand and establish a goal for ranking the losses.
• Problem analysis
• Kaizen implementation
• Outcome attainment
• Standardization and horizontal deployment
| JIPM Loss | ||||
| Index | Terminology | Terminology of Company | Responsible Pillar | |
| Shut-Down | Planned stoppages for preventive maintenance | OTPM | ||
| OVERALL PLANT EFFICIENCY | AVAILABILITY | Equipment Failure | Loss due to equipment breakdown | PM |
| Set-up change | Time taken from stopping m/c for model change from last ok to first component ok of the next model | KK | ||
| Tool change loss | Time taken to replace the tools | KK | ||
| Start up loss | Time taken by the equipment to come to normal Operating condition. e.g. temp., pressure | KK | ||
| Management loss | Time loss for waiting of material | OTPM | ||
| Motion loss | Man hour loss due to the movement of operator from the workstation to other place for taking tool, die, material etc. | KK | ||
| Measurement and adjustment loss | Time loss in frequent measurement & Adjustment to prevent | QM | ||
| EFFICIENCY | Minor stoppages and idling loss | Loss when equipment is temporarily. Stopped for 10 min. e.g sensor actuation, chattering in Parts, parts slippage, chip cleaning, depth adjustment by stopper etc. | KK | |
| Speed loss | Loss cause by difference between Designed speed & Actual Working speed of Equipment | KK | ||
| Line organization loss | Loss for man & machine waiting for component from previous machine | KK | ||
| QUALITY | Defect/ Rework | Reworking damaged components takes time. | QM | |
| COST | Energy loss | Loss as a result of inefficient use of input energy (such as electricity, fuel, or gas) in processing | PM | |
| Die, Jig & tool loss | Loss in Fixtures and Jig Repairs | KK | ||
| Yield loss | Loss as a result of material and paint input and output differences | KK, DM | ||
| Logistic loss | Time and cost associated with material transportation | OTPM | ||
Losses on every machine were recorded in order to improve the equipment’s efficiency. These losses were further described in accordance with the tasks that each of the TPM pillars must complete in order to eliminate losses. The Table 2 below shows the losses occurring at different stages during the operation.
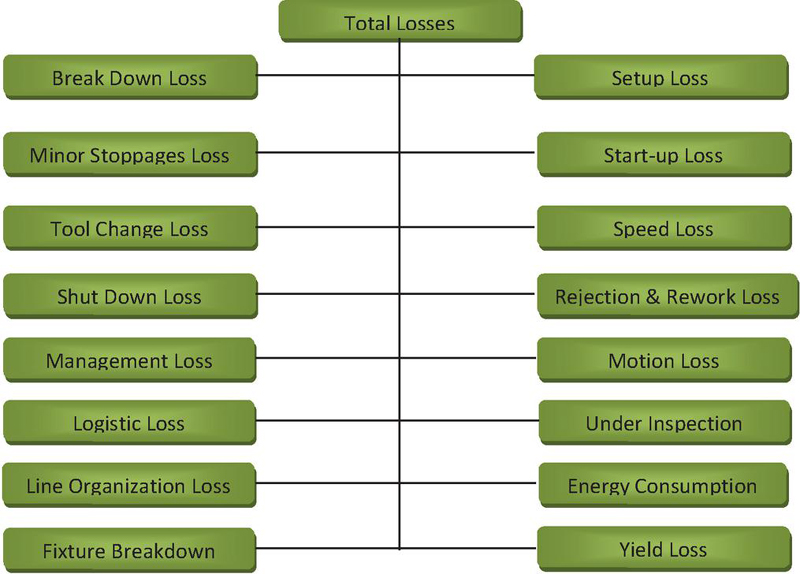
Figure 3 Loss tree.
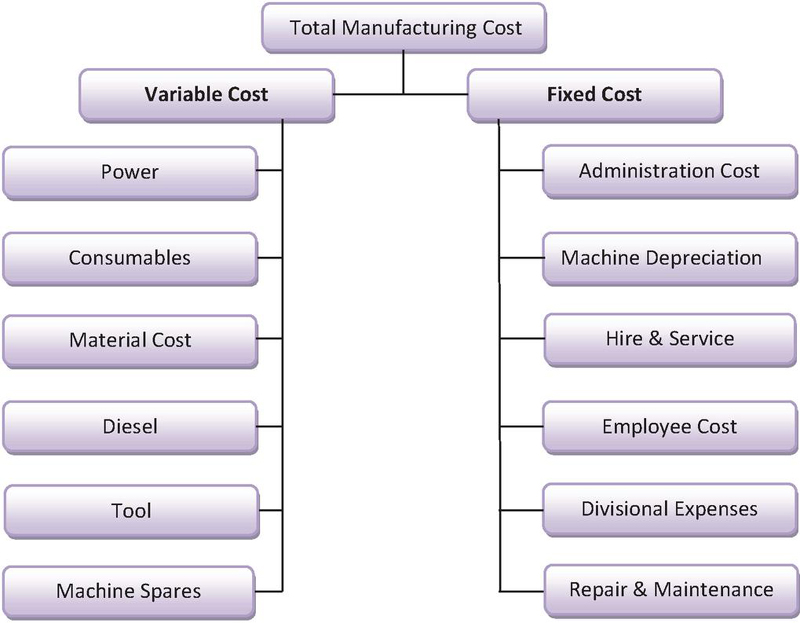
Figure 4 Cost tree.
The loss-cost matrix represents number of losses occurring on the shop floor in all departments eg. Machine shop, assembly shop, paint shop which causes the hampering of overall production cost (varriable as well as fixed) within the industry.
Loss capturing format as shown in Table 3 below was prepared in order to facilitate the data compilation of calculating the OEE of the equipment.
Table 3 Loss capturing format
| “Kobestu kaizen” loss register | ||||||||||||||||||
| Related to the equipment efficiency | Related to the human work efficiency | Related to production resources. | ||||||||||||||||
| SHOP-HMS | 1 | 2 | 3 | 4 | 5 | 6 | 7 | 8 | 9 | 10 | 11 | 12 | 13 | 14 | 15 | |||
| DT | SFT. | M/C Breakdown Loss | Minor Stopp. Loss | Setup & Adjustment Loss | Tool Change Loss | Start Up Loss | Speed Loss | Re-work Loss | Shut Down Loss | Waiting Tool(mgt Loss) | Motion Loss | Line org. Loss | Logistic Loss | Measurement & Adjustment Loss | Energy Loss | Tool Breakage Loss | ||
| 16/1 | A | - | – | 15 | 08 | – | – | – | – | 05 | – | – | – | – | – | – | 30 | – |
| B | – | 05 | – | 10 | – | – | – | – | – | – | 10 | – | – | – | – | – | – | |
| 17/1 | A | – | – | – | – | – | – | – | – | – | 15 | – | – | – | – | – | 18 | – |
| B | – | 03 | 10 | 07 | – | – | – | – | – | – | 15 | – | – | – | – | 8 | – | |
| 18/1 | A | 15 | 06 | 25 | 15 | – | – | – | – | – | 15 | – | – | – | – | – | – | – |
| B | 09 | 12 | 15 | 08 | – | – | – | – | 45 | – | – | – | – | – | – | 6 | – | |
| 19/1 | A | 25 | 12 | – | 10 | – | – | – | – | – | – | – | – | – | – | – | 6 | – |
| B | 25 | 08 | – | – | – | – | – | – | – | – | - | – | – | – | – | – | – | |
| 20/1 | A | 08 | – | – | – | – | – | – | – | 05 | – | 10 | – | – | – | – | 32 | – |
| B | 40 | 12 | – | – | – | – | – | – | – | – | – | – | – | – | – | – | – | |
| 21/1 | A | 15 | 08 | – | – | – | – | – | – | – | – | – | – | – | – | – | – | – |
| B | 24 | – | – | – | – | – | – | – | – | 15 | – | – | – | – | – | – | – | |
| 22/1 | A | – | 07 | 06 | 03 | – | – | – | – | – | – | – | – | – | – | – | – | – |
| B | 15 | – | 12 | 12 | – | – | – | – | – | – | – | – | – | – | – | – | – | |
| 23/1 | A | – | 06 | – | – | – | – | – | – | 25 | – | – | – | – | – | – | – | – |
| B | 55 | 14 | 40 | – | – | – | – | – | – | – | 45 | – | – | – | – | – | – | |
The period of data compilation is July 2022–December 2022. Machine-wise, the losses are detected. The eight main losses that occur in the production and inspection departments are used to determine OEE. The maintenance department collects cost-related losses, while the tool management center collects tool losses. The office TPM team collects management losses, while the quality maintenance team collects vendor-related losses. An employee records the losses throughout his shift or working time on the due date. The loss capture format should record the various losses on various devices together with their magnitude. In terms of loss capturing format, setup loss, tool change loss, and energy loss were the most.
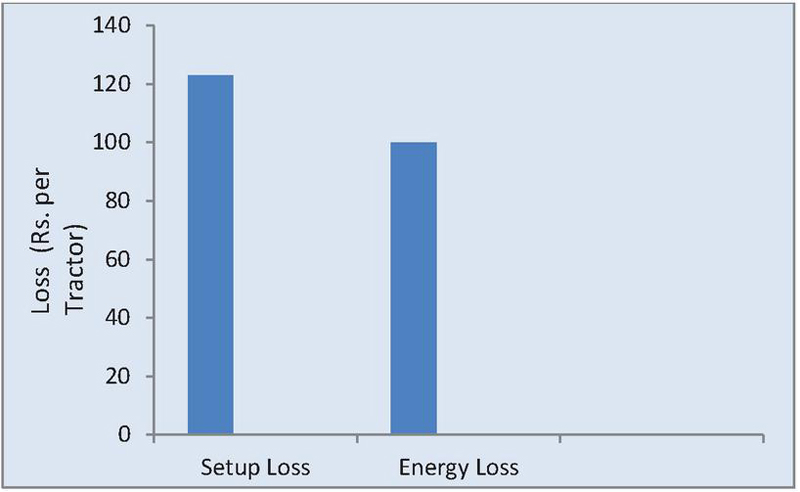
Figure 5 Loss prioritization.
To prioritize the losses, loss cost relationship matrix is prepared with the help of account department considering the variable as well as fixed cost. The losses prioritized as shown in Figure 5 are: –
1. Setup loss
2. Energy loss
The following tools were employed to overcome the losses occurring at several stages of production
1. Root Cause Analysis
2. Quality control tool
3. Before-After comparison
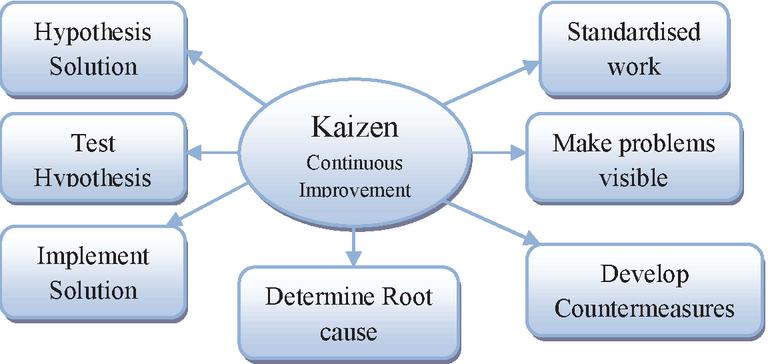
After gathering detailed information about current process kaizen team identify the goal which took into consideration the direction of the management group. Kaizen themes are selected based on losses, setting target and ability of the group to conduct the project.
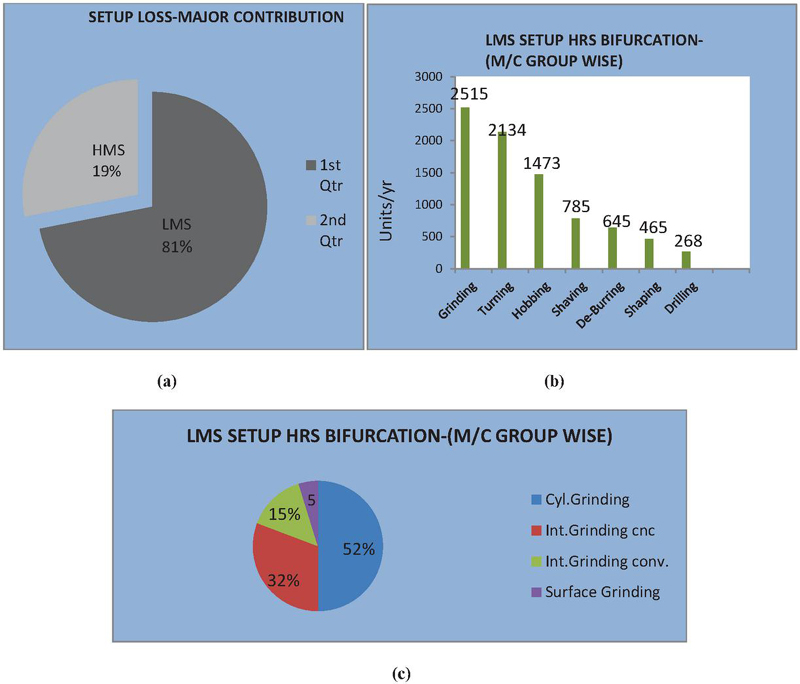
Figure 6 (a) Setup loss. (b) setup loss. (c) setup loss.
The downtime losses causes due to setup and adjustment of the equipments such as exchanging of dies in presses and plastic injection moulding machine. The LMS (light machine shop) department’s grinding section is where the setup loss is occurring. We now looked at each subgroup’s setup time. It was determined after examining the subgroup bifurcation that the cylindrical grinding part accounts for over 52% of the setup time.
After research, it was determined that the current issue is the cylindrical grinding machine’s high setup time (91 minutes/setup).
➢ Implementation of Kaizen to reduce Setup Loss
A great tool for activity analysis is the “Why-Why” analysis tool. Finding the steps in the present procedure that don’t add value and helping the worker get rid of them are beneficial.
➢ Why-Why Analysis for setup loss
Reducing the setup time for the cylindrical grinding machine was the current setup loss issue. Consequently, the core cause of the issue was found by employing why-why analysis, as seen in Figure 7.
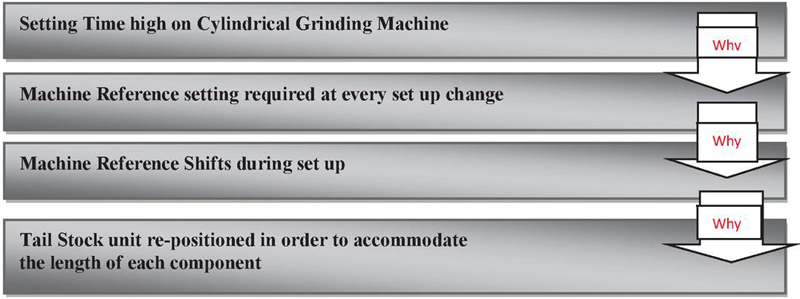
Figure 7 Setup loss.
The repositioning of the tail stock unit was found to be the primary cause following the application of Why-Why Analysis. Therefore, the kaizen concept was suggested in order to solve the issue. Eliminating tail stock repositioning was the kaizen theme. In order to validate the kaizen theme, the hypothesis or evaluation is now conducted (as indicated in Table 4). This was done by implementing kaizen ideas or themes in the relevant department and evaluating their viability based on the outcomes and a comparison of the before and after.
➢ Selection of the Kaizen Ideas
Table 4 Evaluation of Kaizen Idea for setup loss
| Kaizen Idea | Evaluation | Remarks |
| To increase the tail stock plunger movement | This is not feasible as there is a design constraints & also that it involves high cost | Not Valid |
| To design component specific tail stock center | Feasible, can be easily implemented and requires no design modification for tail stock & other parts of the m/c | Valid |
Before Kaizen: After evaluation it is identified that the idea to design component specific tail stock center was valid. For every set up change the tail stock unit is adjusted to accommodate the varying length of the input shaft which was the main reason for set up loss (shown in Figure 8)
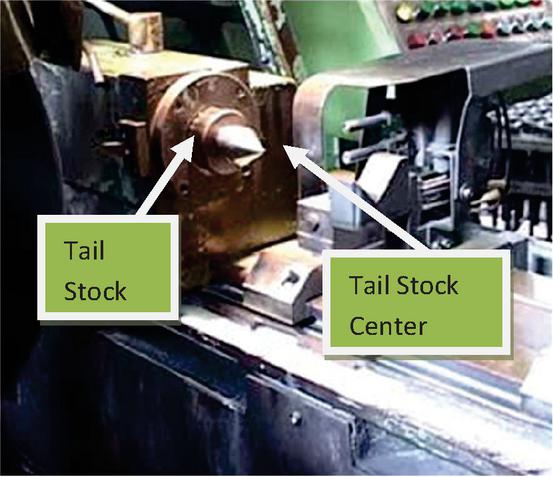
Figure 8 Before kaizen.
After Kaizen: Now the model specific tail stock center have been devolved. In this case tail stock unit is fixed at one position and for any set up change only the tail stock center is changed as per the length of the component (shown in Figure 9).
➢ Saving Achieved after reducing setup loss
Tangible Benefit:
• Significant Cost Saving
• Process time for each component reduced
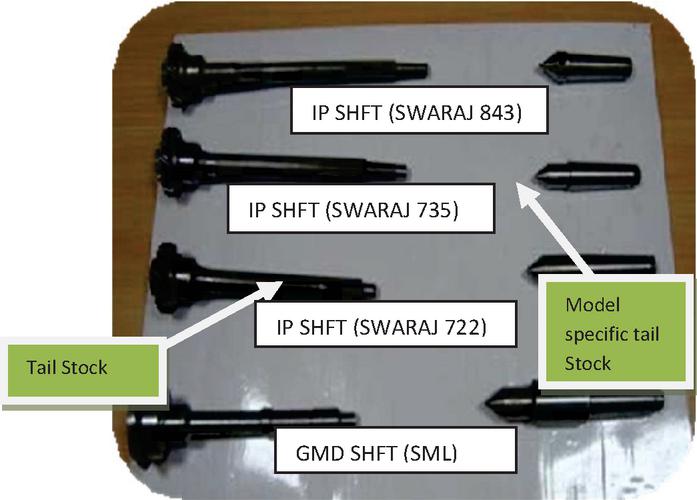
Figure 9 After kaizen.
• Production capacity enhancement and hence increase the production.
Intangible Benefit:
• Faster delivery of the components
• Increase the morale of the operators.
➢ Horizontal Replication of Kaizen Idea
After the successful implementation of kaizen idea and taking measure to prevent recurrences, the same kaizen idea will be implemented on other line or section using same procedure in order to eliminate losses.
Energy Consumption being serious concern for the organization & Society, We have been focusing on all possible areas in order to optimize the Energy Consumption in the Plant. It is evident from loss cost matrix that Energy Losses are the highest contributor. It is the loss due to ineffective utilization of input energy in processing for e.g. electricity, Fuel, gas. Energy loss is taking place maximum in Paint shop i.e. 32% (shown in Figures 10(a) and 10(b)). In Paint shop there are different jost like Chassis Painting, Sheet Metal Painting, PTC (Pre-treatment cell). Out of all these jost 2 have high energy consumption (shown in Figure 10(c)).
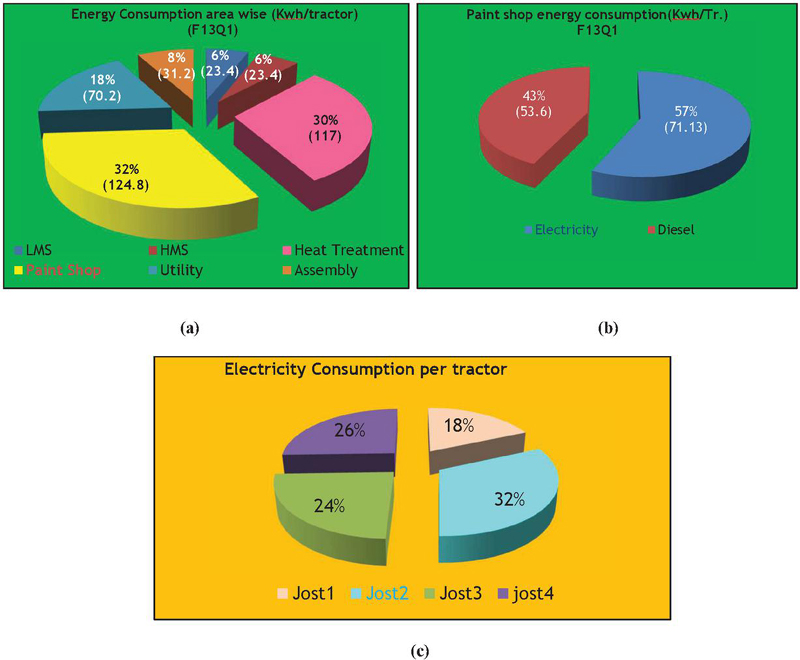
Figure 10 (a) Energy loss.
Now after studying the present problem status, kaizen activity was carried to reduce the electricity consumption per tractor in jost 2.
➢ Why-Why Analysis for Energy loss
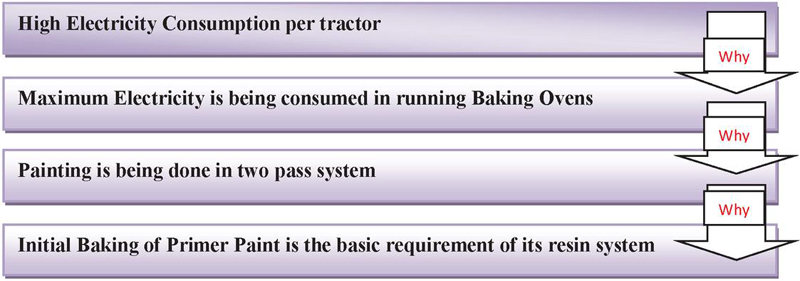
Figure 11 Energy loss.
Following the application of Why-Why Analysis, the primary cause was found to be the primer paint’s first baking, which is a fundamental prerequisite for its resin system. Reducing or eliminating the time spent on primer baking before top coat was the goal of the kaizen notion, which was intended to solve the issue. The Kaizen concept is currently being assessed for viability.
➢ Kaizen Hypothesis:
(1) Increase the conveyor speed in paint booth
(2) Wet on Wet painting application
➢ Evaluation of the Kaizen Hypothesis:
Table 5 Evaluation of kaizen idea for energy loss
| Type | Evaluation | Remarks |
| Increase the conveyer speed in paint booth | When the conveyer speed changed from 0.8 to 1.0 m/s under cured paint film observed after baking the results obtained are:
a. TTR ( Travelling temperature) test and EMT( Effective metal temperature) not achieved. b. Paint Adhesion cross hatch test failed under cure surface. |
Not Valid |
| Wet on Wet Painting Application | By this technique the results obtained are:
a. Baking TTR and EMT test achieved b. Paint Adhesion cross hatch test pass c. Desired DFT (Design for testing) range 55–70 microns achieved on painted components. |
Valid |
➢ Implementation of Kaizen Idea:
After evaluation it is identified that the idea wet on wet painting application found valid (shown in Figure 12). So by implementing the idea it is found:
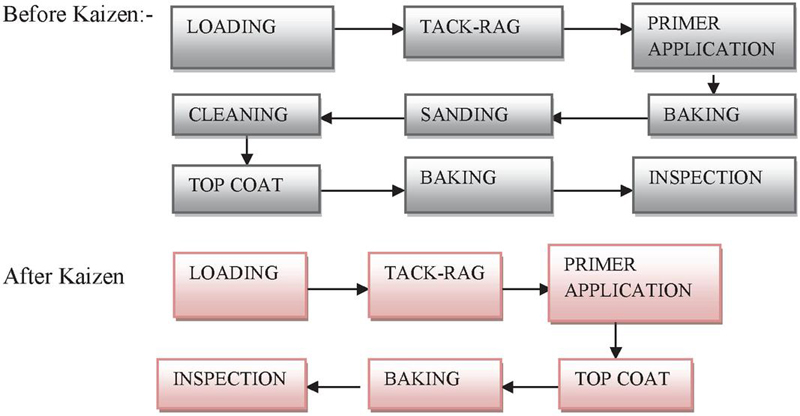
Figure 12 before-after comparison.
➢ Confirmation of Efforts:
For Confirmation, the process on which the kaizen idea was implemented monitored carefully for a period of time to ensure that problem is resolved and corrective actions are implemented.
➢ Monitoring of Saving Achieved for Energy Loss
Tangible Benefit:
(1) Cost Saving
(2) Process time for each component reduced
(3) Production capacity enhancement and hence increase the production.
Intangible Benefit:
(1) Faster delivery of the components
(2) Increase the morale of the operators.
The overall decrease in setup loss following kaizen application is seen in Figure 13(a). The LMS department saw the largest setup loss, accounting for 81% of all setup losses. 52% of the setup time in LMS is spent on the subgroup cylindrical grinding in the grinding section department. The goal was to reach 3875 minutes per setup by 2022, with the setup loss in 2018 being 12177 minutes per setup. Following the adoption of the kaizen concept, the real setup loss decreased from 9800 minutes per setup until 2018 to 3900 minutes per setup until 2022, a 68% reduction in all four josts.
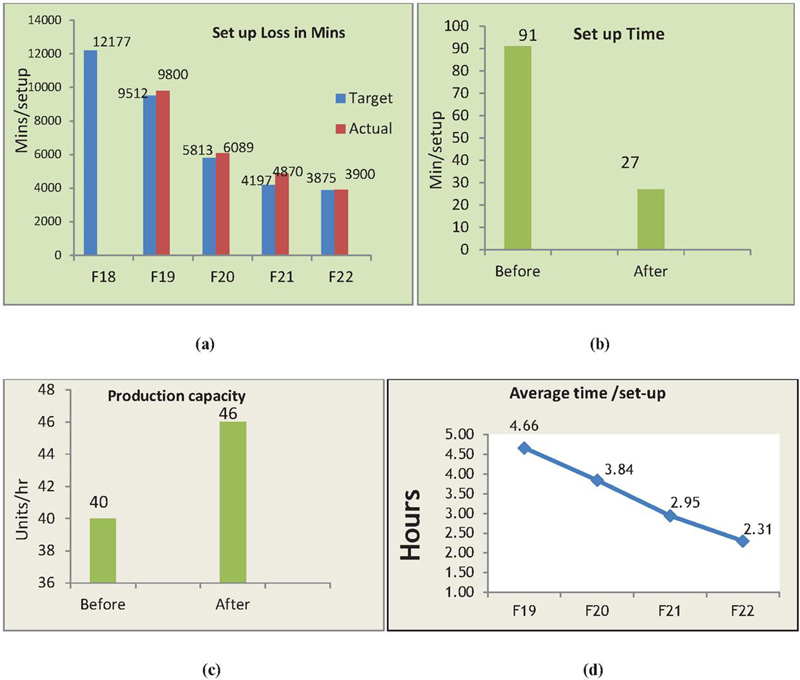
Figure 13 (a) Result for setup loss.
The overall decrease in setup time following the use of the kaizen concept is shown in Figure 13(b). Before the kaizen notion was put into practice, the cylindrical grinding machine setup took 91 minutes. By putting the kaizen concept into practice, it has now been lowered by 70%.
Figure 13(c) illustrates how the application of the kaizen concept increased production capacity by lowering setup loss. The manufacturing capacity was 40 units per hour prior to implementation, but it climbed to 46 units per hour after that, representing a 15% increase. Production will rise in tandem with the expansion of production capacity.
By lowering the setup loss following the application of the kaizen notion, Figure 13(d) illustrates the reduction in average time/setup. After implementing kaizen, the average time/setup dropped by nearly 50% to 2.31 hours from 4.66 hours in 2019.
The overall energy reduction following the application of the kaizen concept is shown in Figure 14(a). The paint business, which used 32% of the energy, had the greatest energy loss. The goal was to reach 390 units of energy usage by 2022, compared to 471 units in 2018. Accordingly, actual energy consumption following the adoption of the kaizen concept was 425 units until 2018, and it further decreased to 390 units until 2022, a 17% reduction.
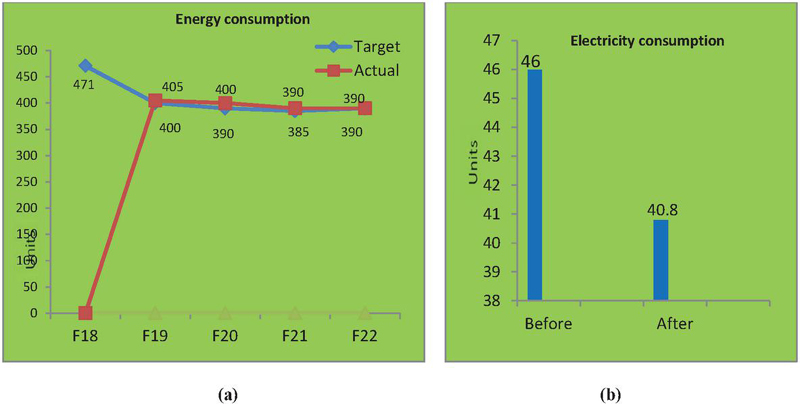
Figure 14 (a) Result for energy loss.
The decrease in electricity consumption following the use of the kaizen concept is shown in Figure 14(b). Electricity usage was 46 units prior to implementation, but after applying the kaizen idea, it decreased by 11% to 40.8 units.
The energy usage and energy-saving kaizen activities over the 2018–22 year are shown in Figure 15. In 2018, 471 units of energy were used per tractor; by 2022, that number has dropped to 390 units. In 2018, there were four energy-saving kaizen projects completed; by 2022, that number had risen to forty-five.
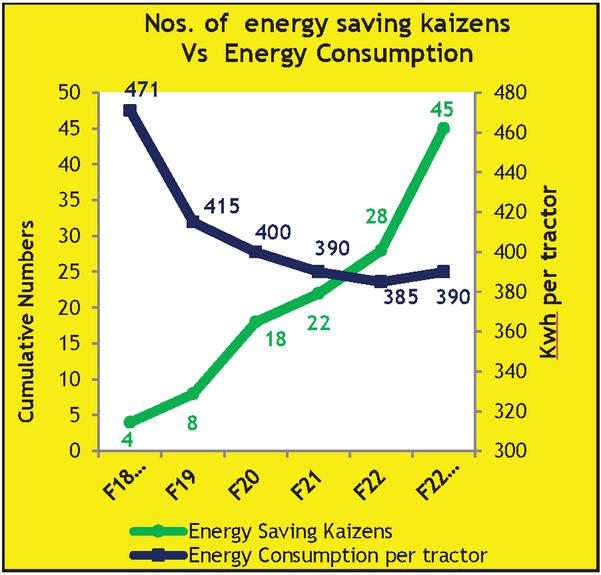
Figure 15 No. of kaizen.
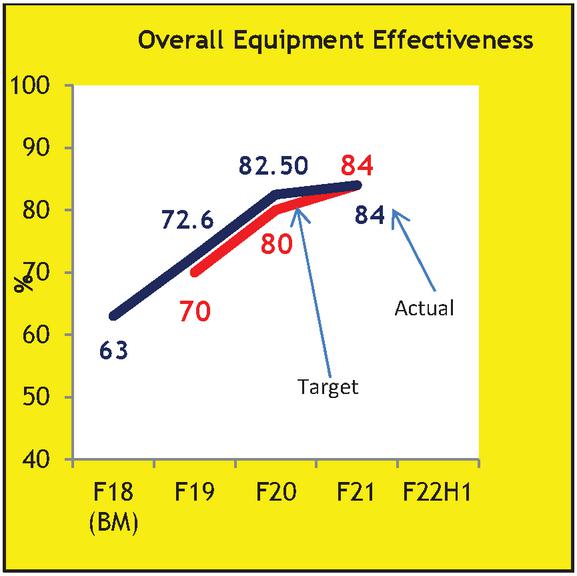
Figure 16 OEE.
Figure 16 illustrates how the application of the kaizen concept increased the overall efficacy of the equipment. The OEE was 63% in 2018 and was expected to reach 84% by 2022. Thus, following the adoption of the kaizen concept, the OEE was 70% until 2019 and rose to 84% until 2022, a 25% improvement.
This study evaluates the degree of lean adoption in the Indian manufacturing organization using kaizen analysis, and then it looks at operational effectiveness. Data is collected by a survey of employees, discussions with industry experts, and a questionnaire designed specifically for the purpose. Overall, this study supports the notion that implementing lean practices results in a 68% reduction in setup loss, a 70% reduction in setup time, a 15% increase in production capacity, a nearly 50% reduction in average setup time, a 17% reduction in total energy use, an 11% decrease in electricity consumption, a 46 percent increase in energy saving kaizen, and, most importantly, a 25% increase in overall equipment effectiveness (OEE). Additionally, the findings were examined in terms of P-Q-C-D-S and M for the year. of 2018-2022.
Productivity:-
(1) 1.7 times more tractors per man each month
(2) 89% decrease in breakdown incidents per month
Quality:
(1) 27% improvement in field quality
(2) 83% decrease in machine shop trash and rework
Cost:
(1) Lower manufacturing costs by 28%
(2) Reduced tool costs by 31%
Delivery:
(1) Schedule compliance of 100%
(2) Reduced by 51% the lead time for equipment development
Safety:
(1) Zero Accidents
(2) First Aid incidences decreased by 95% with no accidents.
Morale:
(1) Kaizen /team/year increased by 8.5 times.
As of now, lean manufacturing is the methodology that fulfils the customer demands by eliminating almost every kind of waste with the help of lean tools and techniques. It acts as a bridge between the success and failure of the company. The future scope using kaizen analysis in a manufacturing company is quite promising, especially in the context of Industry 4.0 and constant demand for efficiency, quality and sustainability. The study is limited to automotive industry only so similar to kaizen analysis there are various other tools of lean manufacturing which can be used in other sectors in order to evaluate the performance of industry. Also, by increasing the sample size results can be more robust.
[1] Sremce Nemanja, Lazarevic Milovan, Krainovic Branislava (2018) “Improving teaching and learning process by applying Lean thinking”.
[2] Dossou, Rafael Pereira, Cristiane Salama (2020) “How to use lean manufacturing for improving a Healthcare logistics performance”.
[3] Sutharsan S.M., Prasad Mohan. M, Vijay. S (2020) “Productivity enhancement and waste management through lean philosophy in Indian manufacturing industry”.
[4] Deshmukh Manish, Gangele Anshu, Kumar Deepak (2022) “Study and implementation of lean manufacturing strategies: A literature review”.
[5] Baysan Serdar, Kabadurmus Ozgur, Cevikcan Emre (2019) “A simulation-based methodology for the analysis of the effect of lean tools on energy efficiency: An application in power distribution Industry”.
[6] Abu Falah, Gholami Hamed, Zakuan Norhayati (2019) “The implementation of lean manufacturing in the furniture industry: A review and analysis on the motives, barriers, challenges, and the applications”.
[7] Jayanth Venkat, B, Prathap, P, Sivaraman, P, Yogesh, S, Madhu, S (2020) “Implementation of lean manufacturing in electronics industry”.
[8] Hardcopf Rick, Shah Rachna (2021) “Lean production and operational performance: The influence of organizational culture”.
[9] Jadhav Pravin, Ekbote Nachiket (2021) “Implementation of lean techniques in the packaging machine to optimize the cycle time of the machine”.
[10] Mawlood Jamal Suha, Sh.Weli Albayatey Ameera, Jassem Amjad Ali (2022) “Investigating the use of lean manufacturing techniques in liquid batteries production: A field research in Babylon plants”.
[11] Pearce Antony, Pons Dirk, Neitzert Thomas (2018) “Implementing lean – Outcomes from SME case studies”.
[12] B. A. Ribeiro Teresa, D. F. FerreiraLuís Miguel (2022) “Analysis of the Impact of Lean and Green Practices in Manufacturing Companies: An Exploratory Study”.
[13] V. Thorhallsdottir Thordis (2016) “Implementation of lean management in an airline cabin, a world first execution”.
[14] B. Surajit, G. Shivam (2018) “Industry 4.0 and supply chain sustainability: framework and future research directions”.
[15] Liker. K Jeffrey (2004) “The Toyota Way 14 Management Principles from the World’s Greatest Manufacturer”.
[16] Rossini M, Audino F (2019) “Extending lean frontiers: a kaizen case study in an Italian MTO manufacturing company”.
[17] Pethkar R.V, Kamble V (2023) “Kaizen Implementation in small scale Industry”.
[18] Abuzied Y(2022) “A Practical Guide to the Kaizen Approach as a Quality Improvement Tool”.
[19] Theresia L, Mauliddina Y “Relationship Between Kaizen, Employees Work and Quality of Service A PLS-SEM Approach”.
[20] Douglas, Stewart M (2001) “The Human side of Mistake-Proofing”.
[21] Soltani Mohyiddine (2023) “Development of an advanced application process of Lean Manufacturing approach based on a new integrated MCDM method under Pythagorean fuzzy environment”.
[22] Jesús Gil Alfonso (2024) “Lean manufacturing tools as drivers of social sustainability in the Mexican maquiladora industry”
[23] Antonelli Dario, Litwin Paweł (2024) “Inclusive manufacturing through the application of lean tools to sustainability issues”.
[24] Naeemah Ali, Yew Wong Kuan (2023) “Sustainability metrics and a hybrid decision-making model for selecting lean manufacturing tools”.
[25] Debnath Debnath (2023) “A Bayesian Best–Worst approach for assessing the critical success factors in sustainable lean manufacturing”.

Amit Surya is a Ph.D. research scholar in industrial and production engineering department at National Institute of Technology, Jalandhar, Punjab, India. He has completed his Master of Technology in Production Engineering from Sant Longowal Institute of Technology, Sungrur, Punjab (India). He has completed his Bachelor of Technology in Mechanical Engineering from Punjab Technical University, Jalandhar. He has about 7 years of teaching experience. His research areas include, TPM, TQM, lean-six sigma.

Rakesh Kumar is a Associate Professor in industrial and production engineering department at National Institute of Technology, Jalandhar, Punjab, India. He has completed his Ph.D. in Mechanical and Industrial Engineering from Indian Institute of Technology, Roorkee. He has completed his Masters in Production Engineering from Punjab University, Chandigarh. He has completed his Master of Business Administration in Human Resource Management from Punjab Technical University, Jalandhar. He has completed his Bachelor of Engineering in Mechanical and Production Engineering from Annamalai University Tamil Nadu.

Rajeev Trehan is a Associate Professor in industrial and production engineering department at National Institute of Technology, Jalandhar, Punjab, India. He has completed his Ph.D. in Industrial Engineering from Dr. B.R. Ambedkar National Institute of Technology, Jalandhar. He has completed his Master of Technology in Industrial Engineering from Dr. B.R. Ambedkar National Institute of Technology, Jalandhar. He has completed his Bachelor of Technology in Mechanical Engineering from Dr. B.R. Ambedkar Regional Engineering College, Jalandhar.
Journal of Graphic Era University, Vol. 13_2, 245–270.
doi: 10.13052/jgeu0975-1416.1322
© 2025 River Publishers