Pecuniary Fraud Uncovering with Intelligent and Collaborative Practices
Jigyasha Arora* and Suyash Bhardwaj
Department of Computer Science and Engineering, Faculty of Engineering and Technology, Gurukula Kangri Deemed to be University Haridwar, India
E-mail: jigyashaarora.cs@gmail.com; Suyash.bhardwaj@gkv.ac.in
*Corresponding Author
Received 02 June 2026; Accepted 25 August 2026
Abstract
The increasing likelihood of financial fraud has become a major worry in a world where mobile connections are necessary for transmitting substantial volumes of data. The Resnet Autoencoder Lasso Regression Feature Selection Hybrid Model (RALFSHM) is a novel artificial intelligence technique designed specifically for processing financial transaction data. Our artificial intelligence method adopts a methodical approach to tackle the growing risk of financial fraud, which poses a significant threat to both financial institutions and their clients. We start the procedure with data preprocessing using a standard scalar, resolving disparity in the data using the Synthetic Minority Over-Sampling Technique Edited Nearest Neighbors (SMOTEENN). Extracting features applies an artificial intelligence ensemble technique that blends autoencoders, Resnet, and Lasso Regression to acknowledge crucial data patterns. At the same time, the Gradient Boosting Machine and Extreme Gradient Boosting hybrid voting classifier (GXVM) evaluate the model’s performance. The GXVM model hyperparameters are a key component of our artificial intelligence classification task. We fully interpret our model using a dataset of pecuniary transactions. This revolutionary study on artificial intelligence promises improved surveillance and competence in fiscal transactions, marking a breakthrough in the continuous conflict against financial delinquency.
Keywords: Artificial Intelligence, Deep Learning, Autoencoder, Resnet, hybrid voting classifier.
1 Introduction
The growth of e-trade and the broad use of digital payment mechanisms have led to a discernible upsurge in fraudulent conduct. According to reliable statistics, between 2020 and 2022, the amount of money lost due to credit and debit card theft escalated significantly [1]. The most startling finding is that using fake credit cards and making illegal purchases account for only (12–17) % of all the reported fraudulent cases. They are accountable for an unusually high fraction of the total losses, between 75 and 80 %. The funding for research and development initiatives has significantly grown for government agencies and private companies in response to these pressing concerns. The fundamental objective is to develop more robust and potent strategies for detecting fraudulent activities. It is now crucial for financial institutions that manage online transactions and credit card issuing to put robotic fraud detection systems into place. These methods are essential for boosting client confidence and assurance and assisting in the contraction of monetary losses. Artificial intelligence and large data have emerged, offering exciting possibilities, especially by focusing on potent machine learning algorithms to fight monetary breaches. With exciting, sophisticated machine/deep learning algorithms and state-of-the-art data analysis, modern fraud detection systems have proven incredibly effective [2]. These algorithms can distinguish between genuine and fraudulent activity since they are typically trained on big-tagged transaction datasets. The need of the hour is the development of models that can distinguish between legitimate and deceitful transactions. It’s challenging to use classification algorithms to identify fraudulent transactions; this calls for ongoing creativity and adaptability. The banking sector needs to develop new ideas to remain forward in combating monetary offences.
Mostly, there is the problem of an unbalanced dataset, in which there are substantially fewer fraudulent transactions than authentic ones. It is also necessary to consider the temporal links between transactions because they show temporal dependence. Additionally, class conditional division may evolve with time due to concept drift, requiring the classifier to be revised regularly. Finally, controlling the feature space’s dimensionality is difficult and necessitates advanced preprocessing methods [3]. A thorough examination of past research revealed that the most widely used approaches for ANNs include DT, LR, and supervised learning techniques [4]. The impressive results of DL in several fields, including image analysis, finance, natural language processing, and computer vision, have attracted researchers. RNNs are represented by GRUs, intended to solve the problems of vanishing gradient and exploding in RNNs [5]. These structures are specifically made to capture temporal patterns in sequential data. Unprocessed data contains essential information that makes deep learning models appealing and consistently shows superior outcomes vs traditional algorithms. The foundation for developing precise and successful fraud detection systems is to convert a fraud dataset’s input data into a lower-dimensional, simpler form [6]. Several traditional ML techniques have been proposed for CCF detection, including SVM, DT, and LR [3]. Deep learning algorithms, such as CNNs, DBNs, and deep autoencoders, are helpful since they are learning approaches. They consist of several layers of data processing, pattern recognition, and illustration learning [9], [10]. DL aims to examine ANNs. The backpropagation model is the primary technique for determining the size of neural networks [11]. As neural networks deepen, the efficiency of the backpropagation algorithm dramatically decreases, which might cause difficulties, comprising insufficient local objectives and a dilution of mistakes. Deep learning designs should be seen as successful, and theoretically, they can significantly address training parameter optimisation [12].
Representation learning techniques are used to create this lower-dimensional representation, which produces a more thorough and insightful representation of the data. Autoencoders have become increasingly popular as useful instruments for representation learning, which is the highlight of the research. Their ability to reveal latent patterns in incoming data before classifying it makes them so appealing. The two primary components of an autoencoder are an encoder and a decoder. The abbreviations used in the paper are indicated in Table 1.
Table 1 Acronyms utilized in the paper
| Technique | Acronym | Technique | Acronym |
| SMOTE ENN | Synthetic Minority Over-sampling Technique and Edited Nearest Neighbors | RNN | Recurrent Neural Networks |
| GRU | Gated Recurrent Network | ANN | Artificial Neural Networks |
| DT | Decision Tree | LR | Logistic Regression |
| XGBoost | Extreme Gradient Boosting | ML | Machine Learning |
| CNN | Convolutional Neural Networks | DBNs | Deep belief networks |
| SVM | Support Vector Machines | CCF | Credit Card Fraud |
| GAN | Generative Adversarial Network | VAE | variational autoencoder |
| DL | Deep Learning | LSTM | Long Short-Term Memory |
| NLP | Natural Language processing | RF | Random Forest |
| SOMs | Self-Organizing Maps | GA | Genetic Algorithm |
| GBM | Gradient Boosting Machine | MSE | Mean Squared Error |
Some research gaps existed in previous studies. The first concern is the imbalanced dataset problem, when there are substantially fewer fraudulent transactions than genuine ones. The second problem is cost sensitivity, in which incorrectly labelling legitimate transactions as fraudulent results in different expenses and serious repercussions. Furthermore, transactions show time dependence, which means that their temporal relationships must be taken into account. This research starts with overcoming the problem of data imbalance by using SMOTEENN to ensure that every class is well represented to improve models’ ability to generalize to new inputs and aggravate the feature vector using Autoencoder and Resnet, along with lasso regression, which uses a learning ensemble to process them. It provides the benefit of efficiently identifying low-dimensional and high-dimensional characteristics in financial transaction data. Through the smooth integration of the advantages of hybrid feature extraction techniques, this novel framework provides adaptability and efficiency in identifying crucial data patterns. Lastly, we used a hybrid voting classifier that combined the GBM and XGBoost algorithms for the classification model. To guarantee scalability across dataset types and sizes, we carefully fine-tune the hyperparameters that accurately detect transaction fraud, which makes it a useful instrument for the financial division. Our model is a useful tool for the financial industry since it quickly and correctly detects transaction fraud, which has a substantial economic impact. Three main research techniques serve as the foundation for our examination and study. A hybrid data balancing method called SMOTEENN is used in machine learning to deal with unbalanced datasets. To enhance classification performance, it mixes under-sampling (ENN) and over-sampling (SMOTE). SMOTE creates fictitious samples for the minority class to maintain dataset balance. It creates new samples between instances of the minority class that are already there using K-nearest neighbors. ENN eliminates samples from the majority class that are unclear or noisy. It further enhances the decision boundary by retaining only informative samples. RALFSHM combines the knowledge gained from three feature extraction techniques, Resnet, Autoencoder, and Lasso Regression, that build on each one’s advantages to produce a cohesive, all-inclusive feature representation. This feature vector becomes a potent tool for improving the model’s ability to recognize significant trends in transactional data. GXVM handles the complexity of huge data while retaining remarkable accuracy in differentiating between legitimate and fraudulent financial transactions. The categorization performance of this model is held to a high level with the help of fine-tuned hyperparameters. This methodology establishes a high bar for categorization accuracy, achieving 0.96 and other evaluation parameters, such as precision 0.94, f1-score 0.96, recall 0.97, and Area Under the Curve 0.99, showing model effectiveness. The paper is organised in the following manner. Section 2 examines the previous research, and Section 3 focuses on the proposed methodology. Results and Discussions are discussed in Section 4, followed by limitations in Section 5. Conclusions and future work are listed in Section 6.
2 Background and Related Work
2.1 Background
This section explores the findings and limitations of the numerous studies on financial transaction fraud. As previously said, setting up a productive fraud detection system is essential in reducing possible losses in the age of extensive e-commerce platform use and ensuing dependence on virtual payment methods. The notable increase in the quantity of credit card purchases handled by virtual outlay systems makes an abundant source of data available that may be efficiently used to create an anomaly identification method powered by data interpretation [5]. Data repositories of credit card transactions provide a variety of attributes, such as time, amount, and class, that can be used in ML models. Despite the abundance of credit card transaction data, publicly available datasets are few that academics can utilize for their studies. Due to rigorous conditions on the disclosure of information in this domain, operators didn’t provide insights into their business operations, which resulted in a lack of data. Many banking firms oppose even the dissemination of anonymized data [6].
Cost sensitivity: It is inherent, as false positives are more expensive than false negatives. The financial institution incurs administrative costs when a valid transaction is mistakenly classified as fraudulent. On the other hand, the value of the transaction is lost if fraud is not detected [7].
Data Imbalance: Concerning fraud detection, datasets frequently include many valid transactions, while just a tiny percentage of the model is trained with bogus ones. Accurate classification results are challenging to achieve due to this skewed data distribution. While the model was being trained, several ML techniques required real and fraudulent examples. Preprocessing the dataset to create an artificial equilibrium is frequently necessary to overcome this difficulty [8]. Oversampling or undersampling techniques can be used as strategies to address data imbalance. To restore data balance, Oversampling approaches include expanding the representation of fraudulent occurrences in a dataset, frequently by duplicating them. Conversely, undersampling techniques decrease the number of typical occurrences to establish data balance. Databases of credit card transactions include a wide range of attributes. To maximize the efficacy of learning strategies, dimensionality reduction techniques must be used. Principal Component Analysis is widely used for feature selection.
2.2 Related Work
Large datasets don’t lend themselves well to these conventional techniques. Transformers, CNN, RNN, DNN, and deep reinforcement learning are examples of deep learning architectures. These deep learning architectures have demonstrated outcomes comparable to or occasionally better than those of human professionals in speech recognition, computer vision, picture recognition, and natural language processing. RNNs, on the other hand, are a major focus of this study and are well-suited for sequential data modeling, including credit card transactions. Despite their ability to efficiently model sequence data, RNNs are difficult to train because of problems with vanishing and bursting gradients [13].
Table 2 An overview of the methods and research contributions used in financial fraud detection
| Data Dimension | Reduction Method | ||
| Reference | Techniques | Reduction | Involved |
| [8] | Ensemble RNN(LSTM+GRU) | – | – |
| [22] | RF, LSTM | – | – |
| [23] | ANN | – | – |
| [24] | ANN | – | – |
| [25] | ANN, LSTM | – | – |
| [26] | LSTM | Yes | PCA |
| [27] | ANN | – | – |
| [28] | DT, LR, RF | – | – |
| [29] | KNN | Yes | PCA & NCA |
| [30] | DT, RF, AdaBoost | Wrapper feature selection | – |
| [31] | Ensemble Neural Network | – | – |
| [32] | SOMs | Yes | – |
| [33] | GA, DT | Yes | – |
| [34] | RF, KNN | – | – |
An autoencoder is defined as a real neural network. Additionally, data can be encrypted using an autoencoder. In the same manner that it decrypts it. This method trains autoencoders. to have no anomalous spots. The anomalous concepts would be shown as “fraud detected” or “no fraud,” implying that the procedure remains unexplored, that is predicted to have a bigger number of variances due to the reconstruction mistake [14, 15]. A GAN is a system in which two neural networks work collectively to enhance the accuracy of the prediction. A GAN is the basic type of DL model [16, 17], and the optimal favourable directions for DL lie in the evolution of the perception of improvement it can suggest. A VAE with regularized training circulation ensures that latent space contains sufficient assets to produce newly acquired data. By incorporating variation based on the autoencoder, a VAE is produced. The LSTM network can be used for classification, processing, and prediction building while working with time sequence data. The LSTM is the most widely used kind of RNN.RNNs are neural networks that typically have short-term memory because of vanishing gradients [18, 19]. Backpropagation is the cornerstone of neural networks since it employs gradients to minimise loss by adjusting network weights. In RNNs, the network’s backbone shrinks as the gradient adjust it, and then the weights are slightly updated. The previous level of networks influences these small changes. They cease to learn, and the RNN transfers into a short-term memory network since it no longer remembers early examples in long sequences [20]. CNN and LSTM effectively process huge datasets and are preferred for NLP and image classification. The practise of DL approaches is currently somewhat limited. The main topic of the study is how these DL techniques carry out CCF classification [21]. An overview of the methods and research contributions used in financial fraud detection is described in Table 2. A smart system for detecting fraudulent payment card transactions was put into place. Quantum KNN is suggested based on a divide-and-conquer approach, possessing better classification results [41]. XGBoost and RF outperform in achieving a balance between false positives and false negatives [42]. The authors used a method to assess if the combined features found by a genetic algorithm might provide fraud detection with higher accuracy than the original features [44]. A technique for unsupervised feature learning that uses a stacked sparse autoencoder (SSAE) to anticipate fraud and improve the efficiency of different classifiers [45].
An innovative feature selection approach to enhance credit card fraud category uses feature selection methods based on ABCs (Artificial Bee Colonies) to detect deceitful accounts utilizing ENNs (Enhanced Neural Networks) for improved accuracy outcome [46]. A technique for detecting fraud that removes highly anomalous minority-class instances by utilizing k-reverse nearest neighbor (KRNN) and hybrid sampling is proposed. Several classifiers, such as naïve Bayes, C4.5 decision tree, and KNN classifiers, were trained using the resampled data [47]. A comparison between several machine learning algorithms was done, and the findings recommended that SVM outperforms LR whenever a class imbalance problem arises. Bagging ensemble works finest for highly imbalanced datasets. Decision Tree gives better results on raw, unsampled data. Neural networks identify fraud with great precision and perform best [48].
3 Proposed System Model
The structured approach to detect deceitful transactions is presented in this section. Our model employs ensemble techniques to address the pressing demand for reliable and effective fraud detection mechanisms, hence decreasing the difficulties related to credit card fraud. This extensive strategy ensures the successful identification of fraudulent activity by utilizing PCA, data dimensional reduction, and an innovative classification method that preserves operational effectiveness while guaranteeing the successful detection of fraudulent activity. The suggested system model is designed to improve fraud detection accuracy, handle the changing characteristics of fraudulent activity, and meet the interpretability norms that are important for financial organisations.
First, we used the features of the dataset as input. The preprocessing stage, which includes normalization and filling in missing values, has been applied. Since fraudulent behavior only makes up 0.2% of all transactions, resolving the dataset’s imbalance in terms of class is necessary to guarantee accurate model training. Following this crucial preprocessing stage, to prevent data leakage, the dataset was first split into training and testing subsets. Furthermore, we move on to the feature extraction stage, using the ensemble Resnet, Autoencoder, and Lasso Regression hybrid Model (RALFSHM). Aspects with high and low dimensions are crucially captured by the model, which offers a thorough method of managing the various levels of false fluctuations in the data. RALFSHM concentrates on collecting inherent features while lowering the dimensionality of the data. Utilizing reconstruction loss functions, like mean squared error (MSE), to train each autoencoder separately makes it easier to retrieve features from the encoder portion. This stage only focuses on obtaining latent features that are necessary for further classification, and it functions irrespective of class labels. In the feature ensemble technique, we combine the features extracted from Lasso Regression and Autoencoder with the features extracted from Resnet. It performs well when dealing with large amounts of data. To address the class imbalance, we start by preparing the data using SMOTEENN. It creates a more equitable distribution of classes, which lessens prejudice towards the majority class. Subsequently, SMOTEENN was applied exclusively to the training data, while the test set was kept completely untouched and retained its original class distribution. This approach ensures that no information from the test set influences the generation of synthetic samples or the data cleaning process performed by SMOTEENN. A hybrid voting classifier model comprising GBM and XGBoost is used to combine the predictions made by each RALFSHM model, producing the final classification result. Furthermore, to achieve more efficiency, we have applied hyperparameter tuning, which increases the report of evaluation metrics. The proposed model and its related stages are depicted in Figure 1.
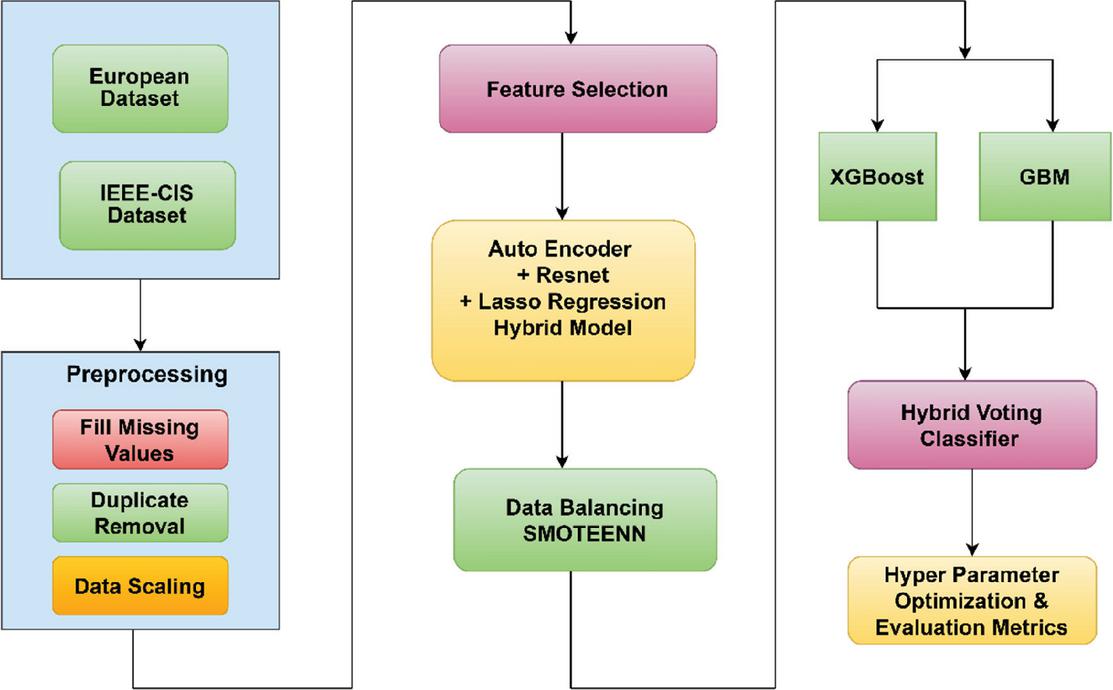
Figure 1 Proposed Model for Detecting Financial Fraud.
The model architecture, parameter settings, and connectivity among these components are further elaborated. Lasso Regression was used for feature selection, using 5-fold cross-validation to establish the ideal regularisation value alpha. The autoencoder module was used to learn compressed feature representations. The encoder converts the input (x) to a latent representation. The extracted encoded features are then used for categorisation. The classification network employed the Adam optimiser, binary cross-entropy loss, 50 epochs, and a 32-batch size for training. The ResNet module comprises an input layer, a dense layer with 16 neurons, Batch Normalisation, and a 0.3 dropout rate. Three residual blocks were used, each containing dense layers with residual skip connections to aid in fast feature learning and gradient propagation. The model employed the Adam optimiser, binary cross-entropy loss, 50 epochs, and a batch size of 32 for training purposes. Furthermore, the selected deep features were fed into the GXVM classifier, which combines Gradient Boosting Machine (GBM) and XGBoost. The initial configuration used 500 estimators, a learning rate of 0.05, and a maximum depth of 7. The ideal configuration was then obtained by optimising hyperparameters using Grid Search.
3.1 Data Set Description
The results have been evaluated using the dataset of credit card transactions. In September 2013, 284,807 credit card transactions from users across Europe were included in the dataset, which became publicly available in Kaggle after a few years. Based on the data visualisation, the dataset exhibits severe class imbalance. There are just 492 instances of illegitimate transactions among all frauds. Each of its 31 columns contains numerical features (v1–v28) computed using PCA transformation. The final three columns are Time, Amount, and Class. Whether the transaction is fraudulent or not is indicated by the class, which has the form of 0 or 1 [35]. There are solely numerical values in the dataset. Upon data preprocessing, there is no missing values and were found in the dataset. No entries for duplicate records were found. Furthermore, data scaling was done using standard scalar and data is split into 75–25% as a balanced split and considered ideal for keeping testing relevant while preventing the model from being overloaded with training data. The rationale behind selecting the dataset is that it displays transactions that took place over two days. Moreover, the dataset seems to be highly unbalanced, which allows working on distinct feature selection and data balancing techniques, enhancing oversight and proficiency in financial transactions. Another IEEE-CIS Fraud Detection Dataset, having 590540 rows and 394 columns, is also considered. Identity-related characteristics and transaction-related characteristics are the important characteristics of the dataset, having 96.50 % as non-fraud and 3.50 % as fraud. To identify the most effective ways to address fraud protection in the industry, they have teamed with Vesta Corporation, the world’s top provider of payment services [50].
3.2 Preprocessing Data
The starting point of financial fraud analysis entails critical preprocessing procedures. These procedures include handling missing data, eliminating duplicate information, and data scaling standardization. Data Preprocessing helps to organize and clean the dataset, creating a solid foundation for accurate analysis and effective modeling to find potential financial fraud situations.
Addressing Missing Values: The dataset contains solely numerical values. The dataset under investigation demonstrates that it is comprehensive and has a numerical value in each column. We discovered that the dataset contains no missing values after using a heat map to represent missing values in a frame.
Eliminating Duplicate Records: Eliminating duplicate records preserves the correctness and dependability of our data, ensures that our dataset contains unique data points, and avoids bias brought on by duplications. Through comparison with all other records, each record is examined, and only the unique ones are kept.
| (1) |
Equation 1 helps find unique records, and the record with no duplicate value is represented as Rexclusive, where ri indicates a unique record, and R indicates the authentic dataset that might have a duplicate record.
Data Scaling: A critical phase in data preprocessing is data scaling, which tries to standardise and compare all numerical features. Equation 2 represents standardization that involves transforming a specific feature, symbolized by the letter Y, which allows us to efficiently examine attributes concerning extra attributes inside a dataset, where Yscaling denotes adjusted features, Y denotes initial features, ü represents average features, and denotes standard deviation.
| (2) |
3.3 Ensemble Feature Selection
We examine the ensemble learning strategy we employ to take advantage of feature extraction with balanced data, utilizing Resnet, Lasso Regression, and Autoencoder models. By linking various extraction features, we hope to make the model work better on a variety of tasks by fortifying its discriminative and resilient qualities.
3.3.1 Feature Selection with Autoencoder
Autoencoders have proven to be remarkably effective at deriving useful illustrations. This special talent enables them to identify complex patterns and nuanced details that could go unnoticed when working with unbalanced datasets. We utilize autoencoders to retrieve characteristics from the balanced dataset. The bottleneck layer recreates the input data, and these autoencoders are trained, providing a clear and insightful representation. We use autoencoders skills in this specific setting to extract these significant characteristics based on the balanced dataset. The encoder consists of two fully connected layers:
Equation 3 represents the latent features of the input data after the first transformation layer, denoted as . is the input data, € where is the weight matrix and € where is the bias vector, x holding various features, and RELU is the activation function that introduces non-linearity and the transformation is given by:
| (3) |
Equation 4 represents the second encoding transformation, denoted as z, creating a more compact hidden encoding of the input data. is now the input data, € , where is the weight matrix and € , where is the bias vector latent representation of the input is given by:
| (4) |
Equation 5 represents the first decoding layer in an autoencoder denoted as . The decoder decodes the encoder in the following steps:
The first decoder layer maps the latent representation from 15 dimensions back to 16. is now the input data. Let € , where is the weight matrix and € , where is the bias vector.
| (5) |
Equation 6 represents the final output layer of the decoder that reconstructs the input by mapping the 16-dimensional vector back to 16, denoted as ü.
€ , where is the weight matrix and € , where is the bias vector.
| (6) | |
The sigmoid activation makes sure that the values are output between 0 and 1, which is appropriate when normalized input data is used within this range.
Equation 7 represents the mean squared error (loss) that measures the reconstruction error defined as:
| (7) |
Original Input Data, Reconstructed Data, and Number of samples in the dataset
Thus, the Autoencoder calls a forward pass followed by a backward pass, parameter update using the Adam optimizer to minimize reconstruction errors, and shuffling to improve generalization and reduce overfitting.
3.3.2 Feature Selection with Resnet
ResNet was originally developed for image recognition tasks; its core innovation, the residual learning framework, is not limited to image data. The residual connections enable the training of deeper neural networks by mitigating the vanishing gradient problem and facilitating efficient feature learning. In the context of the Credit Card Fraud Detection datasets, the transaction records contain complex and non-linear relationships among features that may not be fully captured by shallow models. The use of ResNet allows the model to learn hierarchical feature representations from the tabular transaction data while maintaining training stability. Recent studies have also demonstrated the effectiveness of residual network architectures for structured and tabular datasets, particularly in fraud detection and financial risk assessment applications. Therefore, ResNet was selected to leverage its ability to model complex feature interactions and improve classification performance on highly imbalanced credit card transaction data.
Our feature extraction strategy is greatly improved by incorporating Resnet designs into our methodology. Resnet models have demonstrated intricate hierarchical characteristics, and their efficacy in computer vision tasks is widely known. Resnet models extract important high-level characteristics that are essential for differentiating across classes when working with an evenly distributed dataset. Resnet models effectively capture and portray complex data patterns. The encoding of Resnet takes place with the help of two dense layers, each with batch normalisation, and a shortcut path. Equation 8 represents the first dense layer of the Resnet, denoted as . is the learned weight matrix, is the initial input features, RELU is the activation function, BN is the batch normalization, and is the bias vector.
| (8) |
After batch normalization
| (9) |
The above equation 9 represents the second dense layer as , is the learned weight matrix, and is the bias vector.
Equation 10 represents the skip connection in the resnet block denoted as . The operation adds to the transformed feature, ensuring the gradient flows through the network without vanishing.
| (10) |
Equation 11 represents the output layer (L) that predicts the probability of the positive class, defined as
| (11) |
is the bias term, is the final weight, denotes the transpose of the weight matrix, and is the sigmoid activation function.
Equation 12 represents Binary Cross-Entropy loss (BCE), calculated as
| (12) |
is a true label for sample i, is the predicted probability of the output class, and is the number of training samples. Therefore, Resnet involves the encoding process followed by the classification. The pipeline ensures that a meaningful representation of data is learned by the encoder so that binary classification takes place accurately. Lastly, Resnet minimizes the loss using the Adam optimizer.
The Proposed framework for feature selection is represented in Figure 2, as shown below.
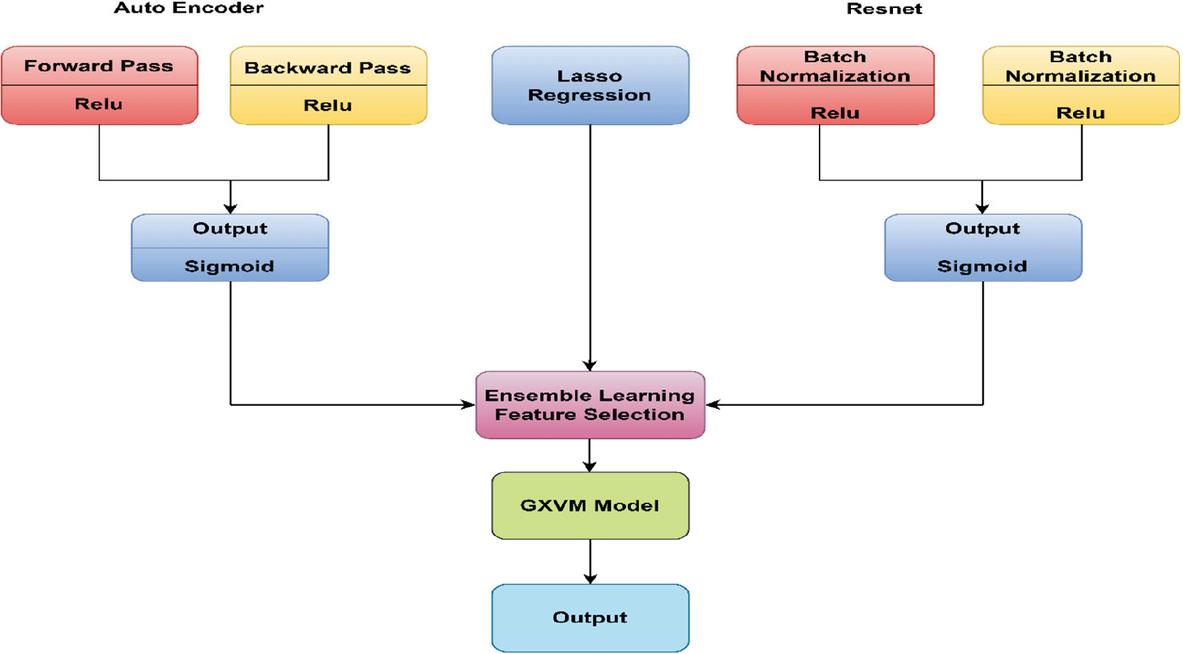
Figure 2 Proposed framework for feature selection.
3.3.3 Lasso Regression
Lasso Regression is a powerful technique that selects important features while regression is performed. It is sensitive to feature scaling and chooses a cross-validation to find the optimal one, thereby identifying features with non-zero coefficients. The attributes selected are combined into a single depiction. Capturing fine details to high-level characteristics, this composite depiction successfully captures extensive attributes extracted from a repository. This fusion method significantly improves our ensemble model’s overall discriminative power. We generate the ensemble feature vector using weighted averaging and concatenation for every data point. In the case of ensemble learning feature selection, we capture the features extracted from the Autoencoder and Resnet and merge them, forming a single ensemble feature selection.
3.4 Data Balancing with SMOTEENN Method
The substantial difference between the number of genuine and deceptive transactions in our dataset is a common challenge in detecting fraud inside financial transactions. This disparity in class presents a special challenge when developing efficient fraud detection models. Specialized methods are needed to solve this problem, and one such method is SMOTEENN, which minimizes class overlap by integrating synthetic data generation and data cleansing. It works in two steps. Firstly, SMOTE produces synthetic minority class samples to produce a more balanced dataset. Secondly, ENN is employed to reduce noise and ambiguity. SMOTEENN tackles the issues of undersampling and oversampling well, resulting in a cleaned and balanced version of the original data. The following two equations (13) and (14) represent the working of SMOTEENN.
| (13) |
Equation 13 is employed to create artificial or synthetic data points for unbalanced datasets, where as a random no that determines the location of the synthetic point between and , denotes the class sample, denotes a randomly selected variable from , and denotes newly generated dataset point. Equation 14 is a rule from the Edited Nearest Neighbor algorithm to clean up noisy samples.
| (14) |
3.5 Classification Using the GXVM Model
XGBoost is a variant of the gradient boosting method. It differs mainly because it applies a regularization methodology, and it performs better in datasets that have numerical and categorical variables. The study [36] extensively explores the cause of XGBoost’s faster operation. The XGBoost model is trained and builds the tree sequentially, therefore minimizing the loss. Equation 15 represents how XGBoost predicts the output of the current ensemble at step , denoted as , where being the activation function, depicts the output of the -th tree for input , symbolizes the decision tree’s index in the boosting sequence, and denotes the boosting round.
| (15) |
We calculate the negative residual, assisting in how the new tree will provide the correct prediction. Regularization is done to prevent overfitting and update the ensemble by adding the new tree. Equation 16 represents the gradient that aids in calculating the amount of modification required to enhance the forecast at step is the loss function that calculates the difference between the actual values and the predicted values , and denotes the first negative gradient of the loss function. Equation 17 takes into account both the gradient and its variations, represents the second negative gradient of the loss function.
| (16) | |
| (17) |
Equation 18 combines the old prediction with a scaled contribution from the new tree, and the revised prediction followed by the addition of the new tree is expressed in represents the previous prediction, being the learning rate, and denotes the new forecast of the decision tree.
| (18) |
On the other hand, GBM is a potent ML technique for handling classification and regression tasks, which best suits our dataset. GBM sequentially constructs trees, with each tree employing gradient descent to minimize a loss function and fix the errors of the preceding trees. Increased attention to cases with higher mistakes gradually improves the model using decision trees as weak learners, and gradient descent maximizes performance. Equation 19 signifies the initial model prediction, denoted as Ġ(x), where M is usedsamples for training and is the actual desired value for each sample i. Equation 20 represents the negative gradient loss to reduce the error as , is the loss function that calculates the variation between actual and predicted values. Lastly, training for a regression model is made to predict .
| (19) | |
| (20) |
The role of the GXVM Model comes into play when each of the models XGBoost and GBM provides class probability estimates for the class y=1, defined as
| (21) | |
| (22) |
Equations 21 and 22 represent and , which are the probabilities produced by the XGBoost and GBM for each instance i. Each model offers a separate estimate for the probability of the class , and represents the test case for which we are forecasting outcomes. Equation 23 represents the average probability denoted as . The average probability is converted to the binary class prediction by applying a threshold of 0.5. If the average probability is higher than 0.5, the model predicts class 1; else, it predicts class 0.
| (23) |
Multiple models’ predictions are combined in a voting classifier. The ensemble function in this case is represented in the equation given below in Equation 24. and represent the predictive function from the GBM and XGBoost models. The classifier averages the expected probability from both classifiers since it employs soft voting, as depicted in Equation 25. Furthermore, M denotes the total number of the ensemble’s model, symbolizes the estimated probability from the ith model for class k. The class that has the highest average probability is chosen, and a loss function such as cross-entropy is minimized over all training samples to train the model. The GSVM Model Hyperparameters are listed in Table 3.
| (24) | |
| (25) |
Table 3 The GSVM Model Hyperparameters
| Parameters | Value |
| N_estimators | 100 |
| Learning_rate | 0.05 |
| Max_depth | 7 |
| Batch size | 32 |
| Cross Validation | 5 |
| Random state | 42 |
| Subsample | 1.0 |
| Epoch | 50 |
4 Results and Discussions
This study presents a paradigm for detecting fraud in credit cards using the proposed model after optimizing the hyperparameters. The outcomes of the classifier evaluation based on the selected evaluated parameters of Recall, Accuracy, Precision, and F1-score are represented in Tables and Figures. The experiment is accomplished by pretraining and testing the dataset with Anaconda Navigator 2.6.2, Jupyter Notebook 7.0.8, and Python. The Anaconda Navigator environment’s libraries include Scikit-Learn, Pandas, Numpy, Tensorflow, and Keras. The research is organized from three different viewpoints. This research work includes three distinct scenarios that we have taken into consideration. The initial phase employs SMOTEENN to address the issue of data balancing. The second phase uses an ensemble feature selection approach (RALFSHM), and the third phase focuses on hybrid classification (GXVM). Table 4 represents the evaluation Metrics of the proposed model and Figure 3. represents the Precision, Recall, and f1-score of the proposed model as shown below.
Table 4 Evaluation Metrics of the Proposed Model
| Precision | Recall | F1-Score | Support | |
| 0 | 0.97 | 0.94 | 0.96 | 34803 |
| 1 | 0.94 | 0.97 | 0.96 | 34785 |
| macro avg | 0.96 | 0.96 | 0.96 | 69588 |
| Weighted avg | 0.96 | 0.96 | 0.96 | 69588 |
| Accuracy | 0.96 | |||
| AUC | 0.99 |
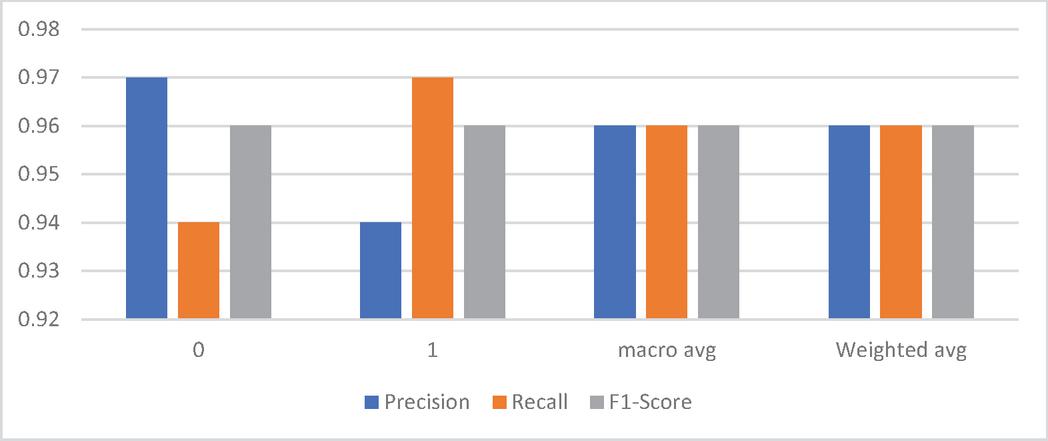
Figure 3 Precision, Recall, and F1-Score of the Proposed Model.
The Proposed model was compared with Support Vector Data Description (SVDD) with three feature selection approaches, namely Wrapper Feature Selection (WFS), Embedded Feature Selection (EFS), and Filter Feature Selection (FFS). A comparison of the proposed model with the existing SVDD is depicted in Table 5 and Figure 4, as shown below.
Table 5 Comparative Evaluation of the Proposed Model with the Support Vector Data Description (SVDD)
| SVDD(WFS) | SVDD(EFS) | SVDD(FFS) | Reference | Proposed | |
| Accuracy | 0.92 | 0.93 | 0.91 | [37] | 0.96 |
| Precision | 0.86 | 0.90 | 0.87 | [37] | 0.94 |
| Recall | 0.97 | 0.97 | 0.97 | [37] | 0.97 |
| F1-Score | 0.92 | 0.93 | 0.93 | [37] | 0.96 |
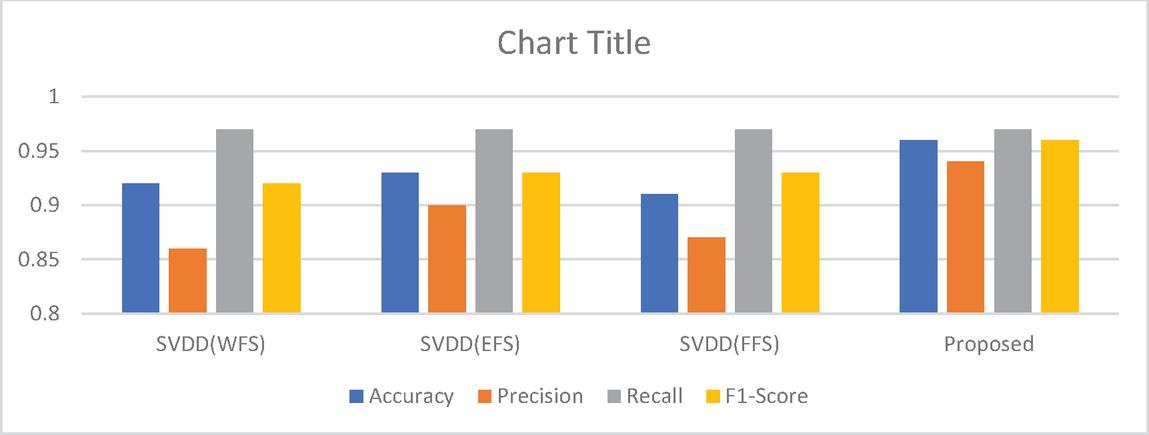
Figure 4 Comparison of evaluation metrics of SVDD with the proposed model.
A comparison of the proposed model with the existing CNN Model is represented in Table 6, and with the existing XGBoost model is depicted in Table 7. Furthermore, a comparative study with existing SVM, LR, and RF models is illustrated in Table 8 and Figure 5, as shown below.
Table 6 Comparative analysis of the proposed model with the CNN model
| CNN | Reference | Proposed | |
| Accuracy | 0.96 | [38] | 0.96 |
| Precision | 0.93 | [38] | 0.94 |
| F1-Score | 0.86 | [38] | 0.96 |
Table 7 Comparative Analysis of the model with the existing XGBoost Model
| XGB + SMOTE | XGB + SMOTEENN | Reference | Proposed | |
| Precision | 0.78 | 0.74 | [39] | 0.94 |
| Recall | 0.85 | 0.85 | [39] | 0.97 |
Table 8 Comparative Analysis of the proposed model with the existing SVM, LR, and RF models
| SVM | LR | RF | Reference | Proposed | |
| Accuracy | 0.93 | 0.94 | 0.93 | [40] | 0.96 |
| Precision | 0.77 | 0.88 | 0.80 | [40] | 0.94 |
| Recall | 0.91 | 0.93 | 0.89 | [40] | 0.97 |
| F1-Score | 0.95 | 0.94 | 0.94 | [40] | 0.96 |
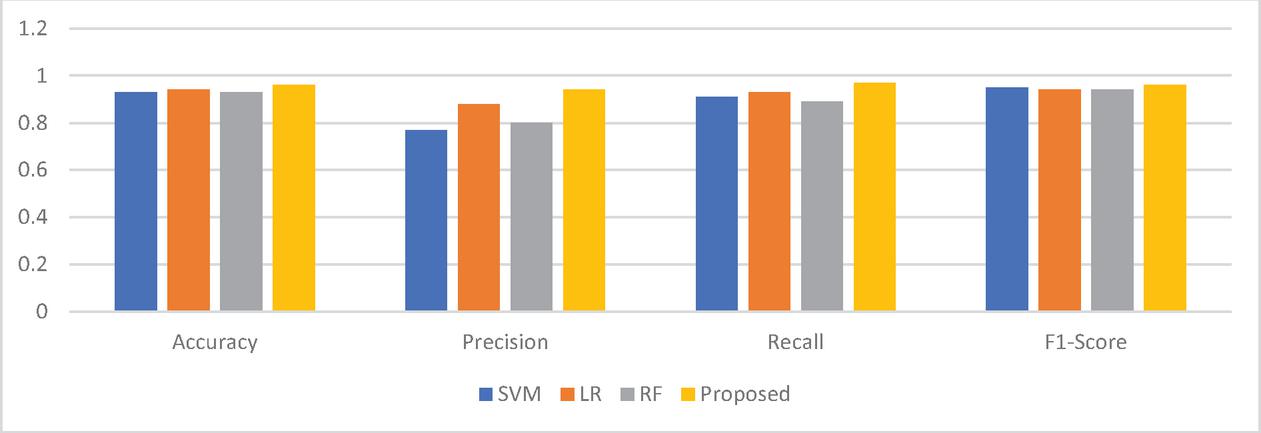
Figure 5 Comparison of Precision, Recall, F1-score, and Accuracy of the Proposed Model with the existing SVM, LR, and RF models.
Furthermore, a comparative study with existing models in terms of AUC is depicted in Table 9, as shown below.
Table 9 Comparative Evaluation of the Proposed Model Area Under the Curve (AUC) with the existing LR, RF, and XGBoost models
| LR with SMOTE | RF with SMOTE | XGBoost | Reference | Proposed | |
| AUC | 0.93 | 0.90 | 0.90 | [43] | 0.99 |
| Recall | 0.89 | 0.80 | 0.80 | [43] | 0.97 |
| F1-Score | 0.11 | 0.86 | 0.86 | [43] | 0.96 |
Lastly, a comparative study with existing models in terms of evaluation parameters is depicted in Table 10, as shown below.
Table 10 Comparative Evaluation of the Proposed Model with XGBoost, Random Forest and Naïve Bayes
| Naïve Bayes | RandomForest | XGBoost | Reference | Proposed | |
| Accuracy | 0.86 | 0.93 | 0.95 | [49] | 0.96 |
| Precision | 0.85 | 0.93 | 0.95 | [49] | 0.94 |
| Recall | 0.85 | 0.93 | 0.95 | [49] | 0.97 |
| F1-Score | 0.85 | 0.95 | 0.96 | [49] | 0.96 |
To evaluate the individual contribution of each component in the proposed framework, we performed an ablation study by systematically removing or replacing individual modules and comparing the performance of each component with the proposed framework. The outcomes are presented in Table 11.
Table 11 Ablation study of several components on European datasets
| Autoencoder + | Resnet + | ||||||
| Autoencoder + | Autoencoder + | Resnet + | Resnet + | Resnet + | Lasso + | ||
| Lasso + | Lasso + | Lasso + | Lasso + | Lasso + | GBM + | Proposed | |
| GBM | XGBoost | GBM | XGBoost | GBM | XGBoost | Model | |
| Accuracy | 0.99 | 0.99 | 0.99 | 0.99 | 0.79 | 0.99 | 0.96 |
| Precision | 0.69 | 0.90 | 0.76 | 0.87 | 0.83 | 0.87 | 0.94 |
| F1-Score | 0.44 | 0.82 | 0.78 | 0.84 | 0.78 | 0.84 | 0.96 |
| Recall | 0.33 | 0.76 | 0.80 | 0.81 | 0.73 | 0.81 | 0.97 |
Although the proposed model achieved an accuracy of 0.96, its precision, recall, and F1-score remained consistently within a comparable range, demonstrating balanced and uniform performance across all evaluation metrics. In contrast, some configurations in the ablation study achieved a higher accuracy of 0.99; however, this improvement in accuracy was accompanied by compromised precision, recall, and F1-score values. This observation is particularly important for an imbalanced fraud detection dataset, where high accuracy may be influenced by the dominant majority class and may not necessarily indicate effective identification of fraudulent instances. Therefore, the proposed model provides a more reliable and well-balanced performance across all evaluation metrics rather than optimizing accuracy alone.
To further assess the robustness and generalization capability of the proposed framework, we conducted additional experiments on an independent dataset, the IEEE-CIS Fraud Detection Dataset, having 590540 rows and 394 columns, using the same preprocessing steps, feature extraction strategy, and classification pipeline. The proposed model achieved an overall accuracy of 97%, precision of 76%, recall of 78%, and F1-score of 77%, demonstrating its ability to effectively identify fraudulent transactions. The precision, recall and F1-score were comparatively lower than those obtained on the European Credit Card Dataset (284,807 transactions and 11 features). The proposed model attained an overall accuracy of 97% and a precision of 76%, demonstrating its ability to identify fraudulent transactions effectively. The recall and F1-score were comparatively lower than those obtained on the European Credit Card Dataset (284,807 transactions and 11 features). This difference can be attributed to the substantially higher dimensionality and complexity of the IEEE-CIS dataset, which contains a much larger feature space and more heterogeneous transaction patterns. Nevertheless, the results indicate that the proposed framework generalizes well while maintaining high predictive performance. and generalization capability when applied to large-scale, high-dimensional fraud detection datasets
5 Limitations
While looking for vital insights, it’s critical to recognize some key limitations that affect how our findings are interpreted and generalized. Despite our careful efforts to use strategies like SMOTEENN to solve data imbalance, there is still a chance that we will overfit to the minority class, which could make our findings less reliable. There isn’t much room for our findings to be applied to different datasets or situations. Although Principal Component Analysis (PCA) is a useful tool for feature selection, some significant traits may be inadvertently eliminated due to its linear structure. This linear characteristic is a limitation that could affect how well the model performs overall. Model overfitting is still a risk even with our stringent anti-overfitting protocols, especially in practical applications. This alternative phrasing presents the limits in a slightly different way without changing their content. Despite the good performance of the proposed Autoencoder-ResNet-Lasso-Ensemble framework for fraud detection, there are some challenges for its practical use in the real-world financial environment. The integration of multiple learning components introduces additional computational complexity and training time, especially when a large-scale transaction dataset is involved. The Autoencoder and ResNet modules are computationally intensive for feature learning and deep representation extraction, which could be a limitation for deployment in resource-constrained environments. Also, real-time fraud detection systems require low-latency prediction and rapid model updates to address the constantly changing fraud patterns. The proposed framework performs well in an offline experimental setting, but its scalability and response time in case of high transaction volumes need further investigation.
6 Conclusions and Future Work
The task of identifying fraudulent transactions is difficult. Despite improvements in security protocols and technology, scammers always have new ways to identify weaknesses and avoid detection. The principal aim of this research endeavor is to offer a framework for detecting fraud. Fraud detection is examined to check the robustness of the proposed model by optimizing its hyperparameters. The initial step is the resampling technique to address the issue of data balancing. The second one uses an autoencoder and resnet as a feature selection to choose the most pertinent qualities. The outcome of the experiment indicates that it is crucial to concentrate on relevant features rather than the feature count. This research emphasizes the importance of feature selection techniques, which consistently present a chance to boost the output and reliability of machine learning models. The resampling method, feature selection strategy, and learning algorithm all have a significant impact on the improvement over the original dataset. Assessing various feature selection strategy combinations is crucial to acquiring the best feasible model. The model outperforms the previous model not only in terms of accuracy but also in terms of Precision, F1-score, Recall, and AUC, considering the same dataset but different algorithms. The model’s capacity to outperform current solutions, significantly increasing prediction accuracy and quickly recognizing intricate, unidentified fraudulent patterns, is a notable highlight. Additionally, our methodology successfully resolves the fundamental inefficiencies of conventional methods. We have carried out a thorough performance study, contrasting our model with other deep learning approaches and traditional machine learning techniques using credit card dataset.
Even though our model has shown a lot of promise, future studies could expand on it by adding more features, such as time and location analysis of fraud, as pertinent information becomes available. This research ensures enhanced security and efficiency in financial transactions, representing a major step forward in combating financial crime. In the larger framework of wireless communications defense, cutting-edge algorithms improve data accessibility, security, and interference resistance. Quantum computing is capable of analyzing and categorizing these transactions in real time by increasing detection accuracy and decreasing false positives. Quantum algorithms like quantum annealing can optimize fraud detection models by rapidly determining the most effective methods for differentiating between fraudulent and legitimate transactions. Fuzzy reasoning at the hyperparameter optimization level can be used, which might bring a difference due to the self-learning rate’s value. Our efforts are crucial in protecting monetary transactions from possible fraud. Future work includes optimisation of the framework for real-time processing of financial transactions using model compression, feature reduction and distributed computing techniques. We can explore incremental and online learning approaches to allow continuous adaptation to new fraud behaviours without the need of retraining the whole model. Moreover, the application of the proposed framework will be explored in cloud-based and streaming environments to assess its scalability, robustness and operational efficiency in large-scale financial systems. Moreover, future research could explore explainable artificial intelligence (XAI) techniques to enhance model interpretability and aid decision-making in practical fraud management settings.
Declarations
Competing Interest: There is no competing interest.
Funding Declarations: No Funding
References
[1] M. H. U. Sharif and M. A. Mohammed, “A literature review of financial losses statistics for cyber security and future trend,” IEEE Access, vol. 15, pp. 138–156, 2022.
[2] Y. Bao, G. Hilary, and B. Ke, “Artificial intelligence and fraud detection,” in Innovative Technology at the Interface of Finance and Operations (Springer Series in Supply Chain Management, Forthcoming), vol. 1. Springer, 2022, pp. 223–247. [Online]. Available: https://ssrn.com/abstract=3738618.
[3] K. G. Al-Hashedi and P. Magalingam, “Financial fraud detection applying data mining techniques: A comprehensive review from 2009 to 2019,” IEEE Access, vol. 40, 2021, Art. no. 100402.
[4] F. Y. Osisanwo, J. E. T. Akinsola, O. Awodele, J. O. Hinmikaiye, O. Olakanmi, and J. Akinjobi, “Supervised machine learning algorithms: Classification and comparison,” Int. J. Comput. Trends Technol. (IJCTT), vol. 48, no. 3, pp. 128–138, 2017.
[5] P. R. Vlachas, J. Pathak, B. R. Hunt, T. P. Sapsis, M. Girvan, E. Ott, and P. Koumoutsakos, “Backpropagation algorithms and reservoir computing in recurrent neural networks for the forecasting of complex spatiotemporal dynamics,” Neural Netw., vol. 126, pp. 191–217, Jun. 2020.
[6] S. Thudumu, P. Branch, J. Jin, and J. Singh, “A comprehensive survey of anomaly detection techniques for high dimensional big data,” J. Big Data, vol. 7, no. 1, pp. 1–30, Dec. 2020.
[7] A. Cherif, A. Badhib, H. Ammar, S. Alshehri, M. Kalkatawi, and A. Imine, “Credit card fraud detection in the era of disruptive technologies: A systematic review,” J. King Saud Univ. Comput. Inf. Sci., vol. 35, no. 1, pp. 145–174, Jan. 2023.
[8] J. Forough and S. Momtazi, “Ensemble of deep sequential models for credit card fraud detection,” Appl. Soft Comput., vol. 99, Feb. 2021, Art. no. 106883.
[9] B. Branco, P. Abreu, A. S. Gomes, M. S. C. Almeida, J. T. Ascensão,and P. Bizarro, “Interleaved sequence RNNs for fraud detection,” in Proc.26th ACM SIGKDD Int. Conf. Knowl. Discovery Data Mining, 2020, pp. 3101–3109, doi: 10.1145/3394486.3403361.
[10] X. Hu, H. Chen, and R. Zhang, “Short paper: Credit card fraud detection using LightGBM with asymmetric error control,” in Proc. 2nd Int. Conf. Artif. Intell. for Industries (AII), Sep. 2019, pp. 91–94, doi: 10.1109/AI4I46381.2019.00030.
[11] F. Cartella, O. Anunciacao, Y. Funabiki, D. Yamaguchi, T. Akishita, and O. Elshocht, “Adversarial attacks for tabular data: Application to fraud detection and imbalanced data,” 2021, arXiv:2101.08030.
[12] N. Kousika, G. Vishali, S. Sunandhana, and M. A. Vijay,“Machine learning based fraud analysis and detection system,” J. Phys., Conf., vol. 1916, no. 1, May 2021, Art. no. 012115, doi: 10.1088/1742-6596/1916/1/012115.
[13] A. Mehrish, N. Majumder, R. Bharadwaj, R. Mihalcea, and S. Poria, “A review of deep learning techniques for speech processing,” Information Fusion, p. 101869, 2023.
[14] R. F. Lima and A. Pereira, “Feature selection approach to fraud detection in e-payment systems,” in E-Commerce and Web Technologies, vol. 278 D. Bridge and H. Stuckenschmidt, Eds. Springer, 2017, pp. 111–126, doi: 10.1007/978-3-319-53676-7_9.
[15] Y. Lucas and J. Jurgovsky, “Credit card fraud detection using machine learning: A survey,” 2020, arXiv:2010.06479.
[16] I. Benchaji, S. Douzi, and B. E. Ouahidi, “Credit card fraud detection model based on LSTM recurrent neural networks,” J. Adv. Inf. Technol. vol. 12, no. 2, pp. 113–118, 2021, doi: 10.12720/jait.12.2.113-118.
[17] H. Zhou, H.-F. Chai, and M.-L. Qiu, “Fraud detection within bankcard enrollment on mobile device-based payment using machine learning,” Frontiers Inf. Technol. Electron. Eng., vol. 19, no. 12, pp. 1537–1545, Dec. 2018, doi: 10.1631/FITEE.1800580.
[18] M. Muhsin, M. Kardoyo, S. Arief, A. Nurkhin, and H. Pramusinto,“An analysis of student’s academic fraud behavior,” in Proc.Int. Conf. Learn. Innov. (ICLI), Malang, Indonesia, 2018, pp. 34–38, doi: 10.2991/icli-17.2018.7.
[19] H. Najadat, O. Altiti, A. A. Aqouleh, and M. Younes, “Credit card fraud detection based on machine and deep learning,” in Proc. 11th Int. Conf. Inf. Commun. Syst. (ICICS), Apr. 2020, pp. 204–208, doi: 10.1109/ICICS49469.2020.239524.
[20] A. Pumsirirat and L. Yan, “Credit card fraud detection using deep learning based on auto-encoder and restricted Boltzmann machine,” Int. J. Adv. Comput. Sci. Appl., vol. 9, no. 1, pp. 18–25, 2018, doi: 10.14569/IJACSA.2018.090103.
[21] P. Raghavan and N. E. Gayar, “Fraud detection using machine learning and deep learning,” in Proc. Int. Conf. Comput. Intell.Knowl. Economy (ICCIKE), Dec. 2019, pp. 334–339, doi: 10.1109/ICCIKE47802.2019.9004231.
[22] Y. Lucas, P.-E. Portier, L. Laporte, L. He-Guelton, O. Caelen, M. Granitzer, and S. Calabretto, “Towards automated feature engineering for credit card fraud detection using multi-perspective HMMs,” Future Gener. Comput. Syst., vol. 102, pp. 393–402, Jan. 2020.
[23] G. Douzas and F. Bacao, “Effective data generation for imbalanced learning using conditional generative adversarial networks,” Expert Syst. Appl., vol. 91, pp. 464–471, Jan. 2018.
[24] S. Bagga, A. Goyal, N. Gupta, and A. Goyal, “Credit card fraud detection using pipeling and ensemble learning,” Proc. Comput. Sci., vol. 173, pp. 104–112, Jan. 2020.
[25] H. Fanai and H. Abbasimehr, “A novel combined approach based on deep autoencoder and deep classifiers for credit card fraud detection,” Expert Syst. Appl., vol. 217, May 2023, Art. no. 119562.
[26] I. Benchaji, S. Douzi, B. El Ouahidi, and J. Jaafari, “Enhanced credit card fraud detection based on attention mechanism and LSTM deep model,” J. Big Data, vol. 8, no. 1, pp. 1–21, Dec. 2021.
[27] P. C. Y. Cheah, Y. Yang, and B. G. Lee, “Enhancing financial fraud detection through addressing class imbalance using hybrid SMOTE-GAN techniques,” Int. J. Financial Stud., vol. 11, no. 3, p. 110, Sep. 2023.
[28] S. Nami and M. Shajari, “Cost-sensitive payment card fraud detection based on dynamic random forest and k-nearest neighbors,” Expert Syst. Appl., vol. 110, pp. 381–392, Nov. 2018.
[29] J. Chung and K. Lee, “Credit card fraud detection: An improved strategy for high recall using KNN, LDA, and linear regression,” Sensors, vol. 23, no. 18, p. 7788, Sep. 2023.
[30] L. Zheng, G. Liu, C. Yan, C. Jiang, M. Zhou, and M. Li, “Improved TrAdaBoost and its application to transaction fraud detection,” IEEE Trans. Computat. Social Syst…., vol. 7, no. 5, pp. 1304–1316, Oct. 2020.
[31] E. Esenogho, I. D. Mienye, T. G. Swart, K. Aruleba, and G. Obaido,“A neural network ensemble with feature engineering for improved credit card fraud detection,” IEEE Access, vol. 10, pp. 16400–16407, 2022.
[32] Y. Chen, N. Ashizawa, C. K. Yeo, N. Yanai, and S. Yean, “Multi-scale selforganizing map assisted deep autoencoding Gaussian mixture model for unsupervised intrusion detection,” Knowl.-Based Syst., vol. 224, Jul. 2021, Art. no. 107086.
[33] R. Jain, B. Gour, and S. Dubey, “A hybrid approach for credit card fraud detection using rough set and decision tree technique,” Int. J. Comput. Appl., vol. 139, no. 10, pp. 1–6, Apr. 2016.
[34] A. Singh and A. Jain, “Cost-sensitive metaheuristic technique for credit card fraud detection,” J. Inf. Optim. Sci., vol. 41, no. 6, pp. 1319–1331, Aug. 2020.
[35] Credit Card Fraud Detection Dataset, Kaggle, San Francisco, CA, USA, 2018.
[36] Afriyie, J. K., Tawiah, K., Pels, W. A., Addai-Henne, S., Dwamena, H. A., Owiredu, E. O, & Eshun, J. (2023). A supervised machine learning algorithm for detecting and predicting fraud in credit card transactions. Decision Analytics Journal, 6, 100163.
[37] Mniai, Ayoub, Mouna Tarik, and Khalid Jebari. “A novel framework for credit card fraud detection.” IEEE Access (2023).
[38] Alarfaj, Fawaz Khaled, et al. “Credit card fraud detection using state-of-the-art machine learning and deep learning algorithms.” IEEE Access 10 (2022): 39700–39715.
[39] Isangediok, Mary, and Kelum Gajamannage. “Fraud detection using optimized machine learning tools under imbalance classes.” 2022 IEEE International Conference on Big Data (Big Data). IEEE, 2022.
[40] Yang, Ge. “Credit Card Fraud Detection Based on Machine Learning Prediction.” 2024 2nd International Conference on Image, Algorithms, and Artificial Intelligence (ICIAAI 2024). Atlantis Press, 2024.
[41] Gong, Li-Hua, et al. “Quantum k-nearest neighbor classification algorithm via a divide-and-conquer strategy.” Advanced Quantum Technologies 7.6 (2024): 230022.
[42] Al-dahasi, Ezaz Mohammed, et al. “Optimizing fraud detection in financial transactions with machine learning and imbalance mitigation.”Expert Systems 42.2 (2025): e13682.
[43] Yan, Chao, et al. “Enhancing credit card fraud detection through adaptive model optimization.” 2024 IEEE 7th International Conference on Big Data and Artificial Intelligence (BDAI). IEEE, 2024.
[44] M. Seera, C. P. Lim, A. Kumar, L. Dhamotharan, and K. H. Tan, “An intelligent payment card fraud detection system,” Ann. Open Res., pp. 1–23, Jun 2021, doi : 10.1007/s10479-021-04149-2.
[45] S. A. Ebiaredoh-Mienye, E. Esenogho, and T. G. Swart, “Artificial neural network technique for improving prediction of credit card default: A stacked sparse autoencoder approach,” Int. J. Electr.Comput. Eng. (IJECE), vol. 11, no. 5, p. 4392, Oct. 2021, doi: 10.11591/ijece. v11i5. pp. 4392–4402.
[46] N. Geetha and G. Dheepa, “Transaction fraud detection using artificial bee colony (ABC) based feature selection and enhanced neural network (ENN)classifier,” Int. J. Mech. Eng., vol. 7, no. 3, 2022.
[47] T. M. Padmaja, N. Dhulipalla, R. S. Bapi, and P. R. Krishna, “Unbalanced data classification using extreme outlier elimination and sampling techniques for fraud detection,” in Proc. 15th Int. Conf. Adv. Comput. Commun. (ADCOM), Dec. 2007, pp. 511–516.
[48] Tiwari, P., Mehta, S., Sakhuja, N., Kumar, J., & Singh, A. K. (2021). Credit card fraud detection using machine learning: a study. arXiv preprint arXiv:2108.10005.
[49] Jemai, Jaber, Anis Zarrad, and Ali Daud. “Identifying fraudulent credit card transactions using ensemble learning.” IEEE Access 12 (2024): 54893–54900.
[50] IEEE-CIS Dataset. Accessed: Sep. 22, 2023. [Online]. Available: www.kaggle.com/competitions/ieee-fraud-detection/data.
Biographies

Jigyasha Arora is currently working as a Research Scholar in the Department of Computer Science & Engineering, Faculty of Engineering & Technology, Gurukula Kangri Vishwavidyalaya, Haridwar. She did her B.Tech in 2011, M.Tech in 2014 and is currently pursuing a PhD under the supervision of Dr Suyash Bhardwaj. Her research areas are Artificial Intelligence, Machine Learning, and Graph Mining.

Suyash Bhardwaj is currently working as Assistant Professor in Department of Computer Science & Engineering, Faculty of Engineering & Technology, Gurukula Kangri Vishwavidyalaya, Haridwar. He is Life Time Member of Computer Society of India (CSI), and Indian Science Congress Association (ISCA). He has more than 70 publications in international journals, conferences, and symposia etc. and attended more than 60 workshops, seminars etc. He is currently guiding three research scholar and one student has completed his Ph.D degree under his guidance. He is guiding many research projects at UG level also. He did his B.Tech in 2008, M.Tech in 2011 and his Ph.D. in 2019. He has an experience of more than 15 years in academics and research. He has been recognized and awarded for active contributions in many national and international programs. His research areas are AI and Machine Learning, Design Thinking and Mobile Adhoc Networks.
Journal of Graphic Era University, Vol. 14_2, 577–606
doi: 10.13052/jgeu0975-1416.1429
© 2026 River Publishers