Influence of Film Morphology on Transient
Photocurrent Pulse Shape in Organic Thin
Films: A Monte Carlo Study
S. Raj Mohan1,*, Manoranjan P. Singh2,3 and M. P. Joshi1,3
- 1Laser Materials Processing Division, Raja Ramanna Centre for Advanced Technology, Indore, India, 452 013
- 2Theory and Simulation Lab, Raja Ramanna Centre for Advanced Technology, Indore, India, 452 013
- 3Homi Bhabha National Institute, Anushaktinagar, Mumbai, Maharashtra, India, 400 094
*Corresponding Author: raj@rrcat.gov.in; rajmho@gmail.com
Received 3 January 2017; Accepted 24 March 2017;
Publication 19 April 2017
Abstract
The influence of film morphology on the broadening of the time-of-flight transient photo-current pulse is investigated using Monte Carlo simulation. Simulation of the time-of-flight transient photo-current pulse shape is carried out for homogeneous and inhomogeneous organic thin films by varying the overall energetic disorder. In homogeneous system, the value of the tail broadening parameter (W) of the photocurrent pulse is found to decrease upon decreasing the energetic disorder, which can be attributed to the variation in the non-thermal field assisted diffusion. Interestingly, in the case of inhomogeneous system, upon decreasing the overall energetic disorder of the system the value of W initially attains a maximum value before it starts decreasing. This observation is explained in terms of the morphology dependent carrier diffusion. This study asserts the importance of the influence of the morphology dependent carrier diffusion on the charge transport in disordered systems and the related experimental measurements.
Keywords
- Film Morphology
- Polycrystalline organic thin films
- Charge transport
- Time of flight photoconductivity
- Tail broadening
- Diffusion
1 Introduction
Extensive investigations on charge transport in disordered organic materials unambiguously establish the hopping charge transport in these materials resulting in low charge carrier mobility [1–5]. The common practice for experimental/theoretical investigation of charge transport in such materials is to study the dependence of charge carrier mobility on various parameters such as electric field, temperature, concentration of dopants, concentration of carriers, film morphology etc. [1–9]. Numerous experimental techniques have been adopted for measuring carrier mobility out of which time of flight transient photoconductivity (TOF) experiment is quite common and is being actively pursued [1–4]. Main reasons for the wider acclaim of TOF experiment are (i) it is simple to perform (ii) the experimental results are independent of electrical contacts used and (iii) it can provide electron and hole mobility separately. In TOF experiment displacement current due to a thin sheet of charge carriers generated (either by short laser pulse [1–4] or by electron beam [10, 11]) at the surface of a thick organic layer, sandwiched between two metal electrodes, under a known applied potential is recorded. A typical non-dispersive TOF current pulse consists of an initial spike, a plateau of variable duration where the current/carrier drift velocity remains almost constant and long tail which suggests the spreading of carrier packet [1–4]. Knowing the thickness of the sample, the applied potential and inferring the transit time of sheet of carriers across the sample from the recorded current pulse, carrier mobility can be calculated [1–4]. By convention the transit time is taken as the time at the point of intersection of tangents drawn on to the plateau and the falling tail part of the current pulse (t0) or the time at which the current has reduced to half of the value at the plateau region (t1/2) [1–4]. In some cases where a clear plateau is not observed, TOF current pulse on a double logarithmic scale is considered for extracting the transit time as mentioned above [1–4]. Even though prime importance of the TOF experiment is to measure the carrier mobility, it also carries information related to the trap states, density of states (DOS), diffusion co-efficient and recombination processes [12–16]. The extracted parameters and the proposed models are highly sensitive to the shape of the current pulse [12–16]. Any change in the experimental parameters/nature of the sample that affects the behavior of charge transport can significantly influence the shape of TOF current pulse [17–19]. Hence, a proper understanding of the various factors and mechanisms influencing the shape of TOF current pulse is important for extracting meaningful information about the material under study. One of the experimentally measurable parameters which characterizes the shape of TOF current pulse is the tail broadening parameter ‘W’ which is defined as W = (t1/2- t0)/t1/2 [17, 18]. ‘W’ basically characterizes the tail of TOF current pulse and hence the shape of TOF current pulse. It is related to the carrier dispersion [17, 18] and hence its dependence on various parameters has been extensively investigated to understand the disorder induced anomalous broadening of tail of TOF current pulse [17, 18]. These investigations have provided valuable information about the influence of various parameters on the shape of TOF current pulse, thereby leading to a deeper insight in to the mechanism of the charge carrier transport.
Film morphology is known to have significant effect on the carrier transport and hence the performance of the device made up of these materials [20–22]. Attempts are being made to tailor the film morphology for achieving better charge transport for fabricating efficient devices [20–22]. While tailoring the film morphology one incorporates more structural order in the otherwise highly disordered system for enhancing the charge carrier mobility. These morphologically tailored thin films are not homogeneous, not purely disordered or amorphous, rather they are partially ordered and hence inhomogeneous [20–22]. The charge transport in such systems occurs through a mixture of ordered and less ordered regions. In such systems, the energetic disorder seen by the carrier keeps fluctuating and hence, the influence of energetic disorder on charge transport [23, 24] becomes complex. How would this affect the shape of the TOF current pulse has not been reported so far? In this study, we investigate the influence of film morphology on the shape of TOF current pulses. The film morphology is varied by incorporating ordered regions in the disordered host with varying concentration. Thus, the influence of morphology on the shape of the TOF current pulse is investigated by studying the variation of ‘W’ with various concentrations of the ordered regions inside the host lattice. It is known from our earlier reports [25, 26] that the overall energetic disorder seen by the carriers decreases with increase in the concentration of ordered regions (COR) inside the highly disordered host lattice. Therefore, this study is also aimed at understanding the effect of the overall energetic disorder on an experimentally measurable quantity such as TOF current pulse. The value of ‘W’ is known to decrease with decrease of energetic disorder for homogeneous systems [18]. Hence, the value of ‘W’ is expected to decrease with increase of concentration of ordered regions as the overall energetic disorder seen by the carrier decreases [25, 26]. Contradictory to this expectation, we find that the value of W initially increases and reaches a maximum value with increase of concentration of ordered regions beyond which it starts decreasing with further increase in the concentration of the ordered regions. A plausible explanation for the intriguing observation is provided on the basis of morphology dependent carrier diffusion mechanism [27].
2 Details of Simulation
The Monte Carlo simulation code, developed in house using FORTRAN, is based on the commonly used algorithm reported earlier [4, 25–27]. A 3D array with size 70 × 70 × 10000 along x, y and z directions is considered as the lattice. The size of the lattice is judged on the basis of our intention to change the lattice morphology and also by considering the available computational resources. The z direction is taken as the applied field direction. Periodic boundary condition is applied along x and y directions. The lattice constant a = 6 Å, a value close to the typical polymer intersite distance [4, 28], is assumed for the entire simulation. Thus simulation is performed for a sample thickness of 6 μm along the applied field direction. For homogeneous system (HS), the site energies in the lattice are assumed to be correlated and follow single Gaussian distribution [27]. The width of the Gaussian distribution is the measure of energetic disorder (σ). Mean energy of the distribution is taken to 5.1 eV, which is close to the value of HOMO level of typical conjugated organic materials. Simulation is performed on an energetically disordered lattice with the assumption that the hopping among the lattice sites is governed by Miller-Abrahams (MA) equation [4]. MA equation for the jump rate (νij) of the charge carrier from the site i to site j is given by,
where, and are the effective energies of the site i and j including the electrostatic energy, a is the intersite distance, ΔRij = |Ri - Rj| is the distance between sites i and j, k is the Boltzmann constant, T is the temperature in Kelvin and 2γa is the wave function overlap parameter which controls the electronic exchange interaction between the sites. γ is the inverse localization radius, whose typical value for disordered organic materials is ∼108cm-1 [4, 28]. Presence of positional disorder results in the local variation in the intersite distance and coupling among the transport molecules and hence the fluctuation in wave function overlap parameter [4]. In simulation this can be implemented by considering the site specific contribution as Γij = Γi + Γj = 2γa, where, Γi and Γj are the site specific contribution each taken randomly from Gaussian distribution with variance and Σ is the variance of Γij [4]. Throughout the simulation the positional disorder is neglected (Σ = 0) and the value of overlap parameter taken to be 2γa = 10, which is a realistic approximation for organic solids with weak intermolecular interaction [4, 25–28]. Using MA equation hopping probability (Pij) of carrier from the present site i to any site j around within a cube of size 7 × 7 × 7 (343 sites) is first calculated. A random number ur from a uniform distribution is chosen to decide the site to which the carrier should jump because each site have a length in random number space based on the Pij.
In this study, single carrier based Monte Carlo simulation is employed, which is appropriate for very low carrier concentration where the influence of space charge effects [29, 30] can be neglected. Generally, TOF experiments are performed at very low carrier concentrations and hence, total charge generated (Qgenerated) is much less than the stored charge (Qgenerated<< 0.05 CV, where C is capacitance of the sample and V is the voltage applied across the sample) [18]). This justifies the use of single carrier Monte Carlo simulation approach for simulating TOF current pulses. In the simulation, every independent carrier is injected randomly on to the first plane of the lattice, which is allowed to hop in the presence of applied electric field until it traverses the total sample length (6 μm). The results are averaged over a few thousand carriers with one lattice realization per carrier. Position of the carrier as a function of time is recorded by which TOF photocurrent pulse, for various values of energetic disorder, is calculated using I(t) = eN(t)(<x(t)>/t), where e is the electronic charge, <x(t)> and N(t) are the average position of carrier and the number of carriers contributing to the photocurrent at a time t respectively [31]. Throughout this study, mentioned otherwise, the simulation is carried for an applied electric field (E) = 6.4 × 10⁵V/cm and temperature (T) = 300 K. The value of E is a typical average field over which the field dependence of mobility follows a lnμ vs E1/2 as predicted by Gaussian Disorder Model (GDM) [25, 26].
For inhomogeneous system (IHS), the lattice morphology is varied by embedding cuboids of ordered regions randomly inside a highly disordered host lattice [25–27]. The size of ordered regions is also chosen randomly. The size of ordered regions is limited to a maximum size of 25 × 25 × 40 sites along x, y, and z directions respectively, if not mentioned otherwise. In the simulation, the average size of the ordered region can be decreased by decreasing the maximum size of cuboids which are inserted to obtain the required COR. The size of ordered region is chosen such that nanoscale morphology can be obtained by changing the COR. Energetic disorder inside the ordered region is assumed to be low compared to that in the host lattice. Such a highly disordered lattice with embedded ordered regions is justified because the organic/polymer films employed in practical devices are mostly morphologically tailored (either intentionally or because of ageing) and therefore contains regions of low and high disorder [20, 21]. The site energies inside the host lattice and ordered regions are assumed to be correlated and follow Gaussian distributions. Throughout the simulation, same mean energy of the DOS (5.1 eV) is assumed for the DOS of host lattice and ordered regions. This is to avoid any influence on charge transport due to the difference in mean energy of host lattice and ordered region. Energetic disorder for the host lattice is taken to be 75 meV, (a typical value of energetic disorder seen in the homogeneous disordered organic materials), and for the ordered regions is taken to be 15 meV (five times less compared to that for the host lattice). Reports have even suggested a ten-fold reduction of energetic disorder inside the polycrystalline regions [32]. Moreover, our earlier studies have shown that the value of energetic disorder inside the ordered region does not have remarkable influence at low values [25].
TOF photocurrent pulses are simulated by varying COR as explained above. Simulations are also performed on a host lattice where the site energies of host lattice are randomly chosen from a narrow (σ = 15 meV) and broad Gaussian distribution (σ = 75 meV), which is the mixed distribution system. In the mixed distribution case, there are no regions of low disorder embedded deliberately. Instead there will be only sites of low disorder that are placed randomly, with the weight governed by the concentration, inside the highly disordered host lattice.
3 Results and Discussions
Figure 1a and the inset therein show the simulated TOF current pulses for various values of energetic disorder in HS, at E = 6.4x10⁵V/cm and T = 300 K, in linear and double logarithmic scale respectively. Current pulses are normalized with respect to the respective values of current at the plateau region. All the simulated current pulses, in linear scale, exhibit an initial spike and a plateau region, with constant current, followed by a tail, which is an indication of carrier dispersion [17, 18]. The charge carrier transit time decreases (consequently mobility increases as evident from the inset of Figure 1b) with decrease in the value of energetic disorder [7, 17]. Using the extracted values of t0 and t1/2 the value of W is calculated, which is found to decrease upon decreasing the energetic disorder (Figure 1b). In homogeneous system, diffusion co-efficient contains the contribution from the thermal and non-thermal field assisted diffusion. The observed variation in W with energetic disorder is due to the variation in the magnitude of non-thermal field assisted diffusion upon changing the energetic disorder. The non-thermal diffusion component is field and energetic disorder dependent and arises due to the wide difference in the jump rates of the carriers at the bottom and top of the DOS [33, 34]. Higher the energetic disorder higher is the contribution from the non-thermal diffusion [33, 34] and hence the higher carrier spreading. Thus, in the homogeneous system, the increase in the W with increase of energetic disorder can be attributed to the enhanced carrier diffusion (i.e. higher carrier spreading) along with the larger carrier transit time.
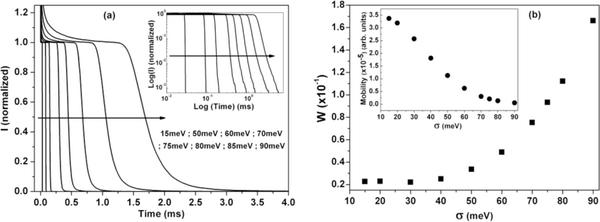
Figure 1 (a) Simulated TOF current pulses for HS at various values of energetic disorder in linear scale. Double logarithmic representation is shown in the inset. Current pulses are normalized with respect to the magnitude of the current at the plateau region. Arrow represents the increasing direction of energetic disorder (b) Variation in the value of W for various values of energetic disorder. Inset shows the variation of mobility with energetic disorder.
Figure 2a and the inset therein show the simulated TOF current pulses for IHS with various values of COR, at E = 6.4 × 10⁵V/cm and T = 300 K, in linear and double logarithmic scale respectively. Similar to the HS, the TOF pulse in linear scale shows an initial spike and a plateau region, with constant current, followed by a tail. The decrease in the overall energetic disorder seen by the carrier upon increasing COR [25, 26] is evident from the corresponding increase (decrease) in the carrier mobility (transit time), see inset of Figure 2b. Therefore, one may naively expect a decrease in W with increase in COR, same as it happens in the HS when the energetic disorder is reduced. Contradictory to the expectation W increases with the increase in COR, as shown in Figure 2b. W attains a maximum value at ∼85% COR. Thereafter it decreases with further increase in COR. The maximum value of W at ∼85% COR is close to the value obtained for 90 meV energetic disorder in HS. This suggests that even though the effective energetic disorder is very low at 85% COR, there exist a remarkable carrier spreading (which is comparable to the carrier spreading in a highly disordered HS). An experimental evidence for the increase of W with increase in crystalline nature (i.e with decrease of energetic disorder) of the sample can be inferred from the TOF pulses obtained from pristine poly(3-hexylthiophene) with different regio-regularities [35]. Increase of film crystallinity along with decrease in overall energetic disorder [35] is equivalent to an increase in ordered regions inside a highly disordered host lattice. Hence, the broadening of TOF pulse with the increase of film crystallinity supports our simulation results.

Figure 2 (a) Simulated TOF current pulses for IHS at various COR in linear scale. Double logarithmic representation is shown in the inset. Current pulses are normalized with respect to the magnitude of the current at the plateau region. Arrow represents the increasing direction of COR (b)Variation in the value of W for various COR. Inset shows the variation of mobility for various COR.
The behavior of W upon changing COR can be attributed to the observed variation in carrier diffusion in IHS upon varying the COR [27]. In case of IHS, the diffusion gets enhanced due to the influence of morphology dependent diffusion (for calculation and the description of morphology dependent diffusion refer [27]). Higher the rate of increase of the diffusion co-efficient, higher is the spreading in the carrier packet and hence a larger W. Thus, the increase in W upon increasing the COR can be attributed to the concomitant enhancement in the diffusion coefficient due to morphology dependent carrier diffusion. W attains the maximum value at ∼85% COR, the COR for which the rate of increase in diffusion co-efficient and the magnitude of diffusion is maximum [27]. With further increase in COR, W decreases with the concomitant decrease in the diffusion co-efficient. Moreover, as the COR increases the whole lattice is approaching towards a HS with low disorder, which also adds to the decrease of W. Thus, in IHS, the observed variation in W upon increasing COR can be explained on the basis of variation in the strength of the morphology dependent diffusion upon changing COR.
Film morphology, at any COR, can be varied by changing the size of ordered region [25]. TOF current pulses for various sizes of ordered regions, at COR = 50%, in IHS are simulated (current pulse not shown). Figure 3 shows the variation in W for various sizes of ordered regions. W is found to decrease upon decreasing the maximum size of ordered region. In our earlier report [27], the morphology dependent diffusion was found to diminish upon decreasing the size of ordered regions. Hence, it is reasonable to argue that the value of W should decrease upon decreasing the maximum size of ordered regions in IHS. This observation establishes a clear connection between the unusual increase in the tail broadening of the TOF current pulses and the morphology dependent carrier diffusion.
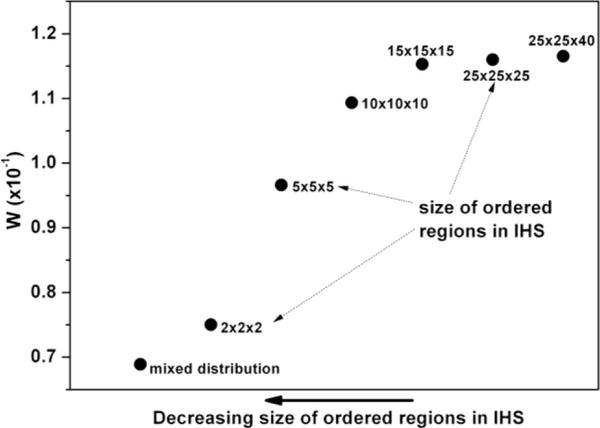
Figure 3 Variation in W upon decreasing the size of ordered regions (COR = 50%, E = 6.4 × 10⁵V/cm). Every data point is labeled with the corresponding maximum size of ordered regions used in IHS. Arrow represents the direction of decreasing the size of ordered regions.
Finally, we have investigated the variation in W in IHS upon changing the electric field strengths. Figure 4, shows the variation in W upon changing the electric field strength in IHS at 50% COR. For comparison, the variation of W upon changing the electric field in HS with energetic disorder 75 meV (COR = 0%), 60 meV and 15 meV (COR = 100%) is also shown. Compared to pure host lattice (COR = 0%), the magnitude of W is higher in IHS for all the electric field strengths under study. The rate of increase of W with electric field strengths (∼>5 × 10⁴V/cm) is slightly higher in IHS, even though the effective energetic disorder of the lattice is much lower at COR = 50%. In case of HS, the rate of increase of W at higher electric field strengths (∼>105V/cm) decreases with decrease in the energetic disorder [18]. Furthermore, in IHS W starts increasing with electric field at low electric field strengths (∼5 × 10⁴V/cm).
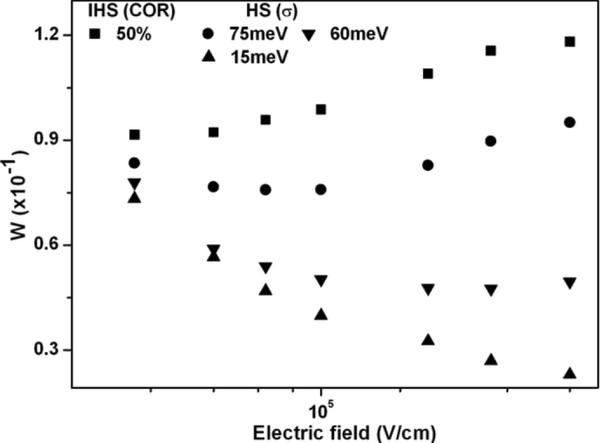
Figure 4 Variation of W upon changing the applied electric field strengths for IHS at COR = 50% and HS for various values of energetic disorder. Simulation carried out at T = 300 K.
In case of HS, at higher values of energetic disorder the magnitude of W is known to decrease to a minima and then starts to increase upon increasing the electric field [18], as shown in Figure 4 for σ = 75 meV. The increase in magnitude of W upon increasing the electric field strength is due to the non-thermal field assisted diffusion at higher electric field strengths. This deviation of diffusion becomes remarkable at higher electric field strengths and at higher values of energetic disorder [18]. An important feature is that the increase of W with electric field strength happens at higher electric field strengths as the energetic disorder decreases. This is because of the non-thermal field assisted diffusion becoming strong enough only for higher electric field strength as the energetic disorder is decreased. Thus, sufficient carrier spreading for an increase of W happens only at higher electric field strengths. At low energetic disorders (eg. σ = 15 meV in our study), the influence of non-thermal field assisted diffusion become very weak and hence the magnitude of W decreases upon increasing electric field strengths.
Investigation on HS shows that the rate of increase of W upon increasing the electric field strength decreases upon decreasing energetic disorder. Hence, compared to the pure host lattice (HS with σ = 75 meV), in IHS at COR = 50% the increase of W with electric field is expected to occur at higher electric field strength. In addition, a smaller rate of increase of W with electric field is also expected. The observations made from IHS are contradictory to these expectations, which can be attributed to the influence of morphology dependent diffusion on carrier spreading upon varying the electric field strengths. For a fixed COR, the enhancement of diffusion co-efficient due to morphology dependent carrier spreading is higher for higher electric field strengths (for the range of electric field under study) [27]. This can provide higher carrier diffusion and hence higher magnitude/higher rate of increase of W with electric field strengths in IHS. The influence of morphology dependent diffusion at lower electric field strengths explains the observed increase of W at lower electric field strengths (∼5 × 10⁴V/cm) in IHS. Hence, in addition to the mobility measurement and the extraction of transport parameters TOF experiment may also provide qualitative insight to the inhomogeneity present in the samples under study upon comparing the variation of W with applied electric field.
This study clearly shows the influence of film morphology on time of flight current pulse, which is explained on the basis of variation in morphology dependent carrier diffusion. This study emphasizes the need of considering morphology while modeling TOF current pulses for extracting materials parameters. In concise, an exclusive influence of morphology dependent diffusion on an experimental data is clearly exemplified and hence, this study highlights the need to consider morphology dependent diffusion while analyzing the various optoelectronic parameters of inhomogeneous organic thin films.
4 Conclusion
In conclusion, this study unambiguously shows the exclusive influence of morphology dependent carrier diffusion on TOF current pulse. It provides a strong evidence for considering morphology dependent carrier diffusion in the analysis of the various optoelectronic parameters of inhomogeneous organic thin films. In organic photonic devices, the active organic layers are mostly morphologically tailored and inhomogeneous. In such cases, the morphology dependent carrier diffusion can significantly influence the exciton diffusion, recombination, charge transport and various other processes. Hence, this study not only highlights the need to consider the film morphology while modeling the transient photocurrent pulses but also asserts the relevance of morphology dependent carrier diffusion in understanding the physics behind the organic photonic devices.
References
[1] G. Hadziioannou, Paul F. van Hutten. Semiconducting Polymers: Chemistry, Physics and Engineering, Wiley-VCH, Weinhelm (2000).
[2] M. Pope and C. E. Swenberg. Electronic Processes in Organic Crystals and Polymers, 2ndEdn Oxford University Press, New York (1999).
[3] S. Baranovski, Charge transport in disordered solids with application in electronics, John Wiley & Sons, England (2006).
[4] H. Bässler, Phys. Stat. Sol. (b), 175, 15–56 (1993).
[5] N. Tessler, Y. Preezant, N. Rappaport, Y. Roicham, Adv. Mater., 21, 2741–2761 (2009).
[6] J. O. Oelerich, D. Huemmer, S. D. Baranovskii, Phys. Rev. Lett., 108, 226403 (2012).
[7] S. Heun, P. M. Borsenberger, Physica B, 216, 43–52 (1995).
[8] H. Tokuhisa, M. Era, T. Tsutsui, S. Saito. Appl. Phys. Lett., 66, 3433–3435 (1995).
[9] M. Abbas, A. Pivrikas, E. Arici, N. Tekin, M. Ullah, H. Sitter, N. S. Sariciftci. J. Phys. D: Appl. Phys., 46, 495105 (2013).
[10] L. B. Schein, V. Saenko, E. D. Pozhidaev, A. Tyuntev, D. S. Weiss. J. Phys. Chem. C, 113, 1067–1073 (2009).
[11] A. P. Tyutnev, V. S. Saenko, E. D. Pozhidaev, V. A. Kolesnikov. J. Phys. Condens. Matter, 21, 115107 (2009).
[12] A. Hirao, H. Nizhizawa, M. Sugiuchi. Phys. Rev. Lett., 75, 1787–1790 (1995).
[13] A. Hirao, H. Nizhizawa. Jpn. J. Appl. Phys., 45, L250–L252 (2006).
[14] M. Brinza, G. J. Adriaenssens. J. Opt. Electron. Adv. Mater., 8, 2028–2034 (2006).
[15] S. R. Cowan, R. A. Street, S. Cho, A. J. Heeger. Phys. Rev. B, 83, 035205 (2011).
[16] A. Ohno, J. Hanna, D. H. Dunlap, A. Cabral. Jpn. J. Appl. Phys., 43, L460–L463 (2004).
[17] P. M. Borsenberger, L. T. Pautmeier, H. Bässler. Phys. Rev. B, 48, 3066–3073 (1993).
[18] P. M. Borsenberger and D. S. Weiss, Organic Photoreceptors for Xerography, Vol. 59 of Optical engineering series, Marcel Dekker, New York (1998).
[19] A. P. Tyutnev, D. S. Wiess, D. H. Dunlap, V. S. Saenko. J. Phys. Chem. C., 118, 5150–5158 (2014).
[20] A. Salleo. Mater. Today, 10, 38–45 (2007).
[21] F. Liu, Y. Gu, J.W. Jung, W. H. Jo, T. P. Russel. J. Polym. Sci., Part B: Polym. Phys., 50, 1018–1044 (2012).
[22] M. M. D. Ramos. H. M.C. Barbosa, H. M. G. Correia. Mater. Sci. and Eng. B, 176, 468–472 (2011).
[23] L. B. Schein. J. Phys. Chem. C, 112, 7295–7308 (2008).
[24] S. V. Novikov, A. V. Vanikov. J. Phys. Chem. C, 113, 2532–2540 (2009).
[25] S. Raj Mohan, M. P. Joshi, M. P. Singh. Org. Electron., 9, 355–368 (2008).
[26] S. Raj Mohan, M. P. Singh, M. P. Joshi. J. Phys. Chem. C, 116, 2555–2562 (2012).
[27] S. Raj Mohan, M. P. Singh, M. P. Joshi, L. M. Kukreja. J. Phys. Chem C, 117, 24663–24672 (2013).
[28] W. R. Saleneck, K. Seki, A. Kahn, J. Pireaux, Conjugated Polymer and Molecular Interfaces: Science And Technology For Photonic And Optoelectronic Application, Marcel Dekker, New York, (2002).
[29] (a) J. Zhou, Y. C. Zhou, X. D. Gao, C. Q. Wu, X. M. Ding, X.Y. Hou. J. Phys. D: Appl. Phys., 42, 035103 (2009). (b) J. Zhou, Y. C. Zhou, J. M. Zhao, C. Q. Wu, X. M. Ding, X.Y. Hou. Phys. Rev. B, 75, 15320 (2007).
[30] L. Meng, D. Wang, Q. Li, Y. Yi, J. L. Bredas, Z. Shuai. J. Chem. Phys., 134, 124102 (2011).
[31] S. V. Noikov, D. H. Dunlap, V. M. Kenkre, A. V. Vannikov. Proc. SPIE, 3799, 94–101 (1999).
[32] J. R. Durrant, J. Konester, D. Wiersma. Chem. Phys. Lett., 222, 450–456 (1994).
[33] L. Pautmeier, R. Richert, H. Bässler. Philos. Magz., 63, 587–601 (1991).
[34] A. I. Rudenko, V. I. Arkhipov. Philos. Magz., 45, 177–187 (1982).
[35] R. Mauer, M. Kastler, F. Laquai. Adv. Funct. Mater., 20, 2085–2092 (2010).
Biographies

S. Raj Mohan obtained M.Sc. (Physics) from CUSAT, in 2001. He did his Ph.D. thesis work at RRCAT on Optoelectronic Properties of Organic Semiconducting Materials. He was awarded Dr. K. S. Krishnan Research Associateship and later joined at RRCAT in 2009. At present, his interests are on the research and development of organic materials based optoelectronic devices.
M. P. Singh M.Sc. (Physics), 1986, Indian Institute of Technology, Kanpur, Ph. D. (Physics), 2003, Devi Ahilya University, Indore, Postdoctoral Research, 2004–2006, Department of Physics and Astronomy, UC Irvine, CA. Area of Research: Neural Network Modeling, Intracellular Transport, Bose-Einstein Condensation in dilute atomic gases, Nonlinear Optics, Strong field Quantum Electrodynamics and Charge transport in disordered systems.

M. P. Joshi obtained M.Sc. (Physics) in 1987 from IIT Bombay and joined RRCAT in 1988 after graduating from BARC training school. He received Ph.D. degree from IIT Bombay for his work on linear and nonlinear optical properties of fullerene and fullerene based composite materials. Presently he is involved in R & D of growth and characterization of organic thin films and nanostructures for various optoelectronic application.
Journal of Self-Assembly and Molecular Electronics, Vol. 1, 1–16.
doi: 10.13052/jsame2245-4551.2017.001
© 2017 River Publishers. All rights reserved.