Improved Anti-Fouling Performance
of Sintered Alumina Membrane Filters
Modified with Grafted-on PEG-Brush Polymer
Dennis A. Nielsen1, Lasse Christiansen1, Allan H. Holm2, Karin Dooleweerdt2, Leonid Gurevich1,* and Peter Fojan1
- 1Department of Physics and Nanotechnology, Aalborg University, 9220 Aalborg East, Denmark
- 2Grundfos Holding A/S, 8850 Bjerringbro, Denmark
Corresponding Author: lg@nano.aau.dk
Received 10 August 2016; Accepted 4 October 2016;
Publication 2 November 2016
Abstract
Fouling of membrane filters is the key performance limiting factor in membrane filtration. Thus fouling and anti-fouling have received much attention in recent years, covering topics from fouling mechanisms and characteristics to anti-fouling surface modifications. This paper presents a method to achieve controlled grafting of an anti-fouling poly(ethylene glycol) (PEG) brush polymer layer onto a sintered alumina membrane filter surface without reduction of the filter permeability. The obtained PEG layers were characterized using a broad range of surface techniques including Fourier transformed infrared spectroscopy, ellipsometry, atomic force microscopy, and contact angle measurements. Dead-end filtration experiments with PEG-brush modified filters showed improved fouling reversibility for the filtration of a BSA solution and significantly slowed down the fouling rate during filtration of a lysozyme solution. The cross-flow filtration of model lake-water demonstrated improved foulant removal for the PEG modified filters during backflush cleaning and thereby increased the overall throughput during a filtration cycle as compared to the bare membrane filters.
Keywords
- Membrane filtration
- fouling
- surface modification
- poly(ethylene glycol)
1 Introduction
Membrane fouling is the main performance limiting factor in water treatment [1]. Generally, fouling refers to the material build-up on membrane filters during filtration, which leads to deterioration of filter permeability and throughput [2]. This increases the need for frequent chemical cleaning and replacement of filters, hence increasing operation costs, and is an impeding factor for further implementation of membrane filtration systems in water treatment [3]. Fouling is usually divided into reversible and irreversible. Pore blocking and pore narrowing tends to be irreversible, while cake layer formation is, to a higher extent, reversible [4].
Anti-fouling measures have received much attention in the past decades [5, 6]. One main objective has been to modify the membrane filter surface in order to slow down irreversible fouling [7]. Different mechanisms can be used to lower the fouling rate or to make fouling more reversible. This can be achieved by increasing the hydrophilicity, altering the surface charge, or decreasing the surface roughness [8]. Microsieves [9], plasma treatment [10], hydrophilic coating and grafting [11] have all been applied to improve the anti-fouling capabilities of membrane surfaces.
Protein adsorption to membranes is a specific case of biofouling. Inert surfaces are able to resist this adsorption, making them a candidate for antifouling membranes [12–15]. Inert surfaces share some common characteristics: they should be charge neutral, contain hydrogen-bond acceptors, and be hydrophilic [16]. One material that fulfills all these criteria is PEG [17].
PEG films can be formed on a surface in different ways. The fact that the surface of interest is porous complicates traditional methods such as spin-, dip-, and spray-coating, since they are likely to clog the pores. To maintain the permeability of a membrane filter, the PEG layer should be of nanometer-thickness and covalently attached to the surface of a membrane filter. This can be achieved by grafting PEG onto a membrane by surface initiated polymerisation as has been proposed by Kahn and Huck [18]. Advantages of this method are that the polymer can be grown directly on the surface, the resulting film is durable, forms a dense brush, and is covalently bound to the surface. Moreover, the process only requires hydroxyl (O-H) terminated surfaces.
In this work, we present an approach to improve fouling reversibility of ceramic filters by applying surface-initiated PEG layer growth. In the present manuscript we demonstrated that such modification could drastically improve the fouling resistance of a filter without loss in filter permeability. The modification procedure was first established on sapphire wafers, where surface analysis techniques could be easily applied as a proof of concept. Afterwards the modification procedure was transferred to alumina membrane filter surfaces. We have shown the successful modification of commercial ceramic membrane filters with a few nanometer thick PEG film and its impact on the anti-fouling properties of the membrane filter during filtration of protein solutions and model lake-water.
2 Materials and Methods
Glycidol (96%), anhydrous methanol (99.8%), and sodium methoxide (97%) were obtained from Sigma Aldrich. Sapphire wafers were obtained from Edmund Optics and aluminium oxide membrane filters with a nominal average pore diameter of 200 nm were obtained from Kerafol.
Prior to polymerisation, the substrate (sapphire wafer or filter) was sonicated sequentially for 2 minutes each in acetone, water, and ethanol and dried under a nitrogen steam. This was followed by treatment in a UV-ozone cleaner (Bioforce Nanosciences) for 5 minutes after which the substrate was transferred to demineralised water and rinsed with ethanol.
The surface of the substrate was activated by placing it in a reaction vessel containing a 0.18 M solution of sodium methoxide in anhydrous methanol at 75∘C. This procedure substitutes the hydroxy-terminations on the aluminium oxide surface with an O-Na+ termination. This termination acts as an initiator for the polymerisation. After activation the sample was rinsed twice using methanol and twice using ethanol. Furthermore, the filters were sonicated in ethanol for 10 minutes to remove sodium methoxide from the pores.
Polymerisation on the activated substrate was carried out in a different reaction vessel. Glycidol was added and the vessel was placed in a 110∘C oil bath. The oxygen ion in the O-Na+ termination reacts with the epoxide in glycidol, which opens the epoxide ring. This creates two new reaction sites for further polymerisation, and eventually causes the branched structure of the polymer [18]. The full reaction sequence is shown in Figure 1. Finally, the sample was rinsed twice with ethanol, sonicated 10 minutes each in acetone and ethanol, and dried under a nitrogen steam. This polymerisation procedure has successfully been carried out on silicon surfaces [18] and on aluminium surfaces [19].
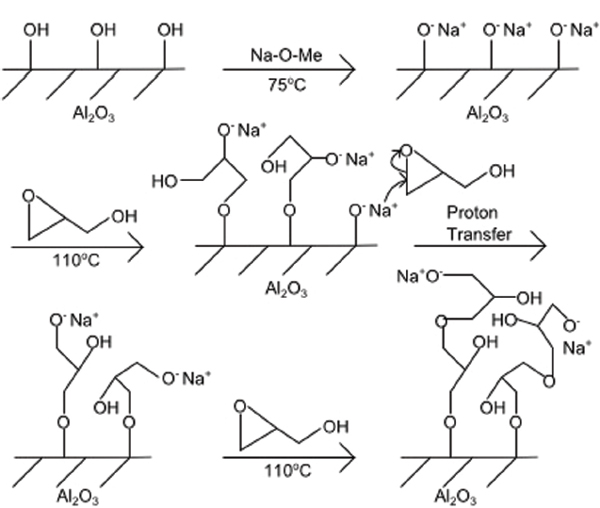
Figure 1 Reaction scheme for surface-initiated ring-opening polymerisation of glycidol on alumina surface.
Atomic force microscopy (AFM) measurements were performed on the PEG films grown on sapphire wafers as well as on a clean sapphire wafer used as reference in order to investigate the roughness of the PEG films. Both samples were sonicated for 5 minutes in ethanol prior to characterization. The AFM measurements were carried out on an NTEGRA Aura Nanolaboratory (NT-MDT) using standard silicon AC160TS cantilevers (Olympus). The samples were scanned across an area of 40×40 μm. The results were analysed using the WSxM [20] software package. From the topography, the root-mean-square surface roughness, RRMS, was determined as
where N is the total number of scan points, zi is the height measured at point i, and is the mean sample height.
In order to verify the presence of PEG film on sapphire wafers, three different investigation techniques were applied. Initially, ellipsometry w as used to determine the thickness of the grown film. Then transmission infrared spectroscopy was performed to determine the chemical bond present in the film. Finally, contact angle analysis was carried out in order to confirm an increased surface hydrophilicity. In combination, the obtained information combined with the knowledge of the growth process and chemical properties of PEG enables verification of the presence of a PEG film.
Ellipsometry measurements were carried out on a Sentech SE850 ellipsometer using the wavelength range from 300 nm to 800 nm. The refractive index of sapphire was described by the Tauc-Lorentz model. The real part of the refractive index of PEG was described by the Cauchy model in the form
where c1 = 102 and c2 = 107 are the factors used in the ellipsometry software and λ is the wavelength in nanometers. The Cauchy coefficients used in these measurements were n0 = 1.4581, n1 = 39.41 nm2, and n2 = 5.39 nm4 as experimentally determined by Ford et al. [21] for linear PEG molecules. The sapphire wafer used for ellipsometry measurements was polished into a wedge shape in order to direct the reflection from the bottom of the sample away from the detector. This was necessary, because sapphire is transparent and the reflection from the bottom surface would disturb the measurement to the extent that the PEG film thickness could not be obtained.
Transmission infrared spectroscopy measurements were carried out using a Varian 660 infrared spectrometer. Wavenumbers corresponding to vibrational excitation energies in PEG are 3600-3200 cm-1 for O-H stretching, 2960-2850 cm-1 for C-H stretching, and 1150-1070 for C-O-C scissoring. If unpolymerised glycidol should be present in the PEG film it can be detected through vibrational excitation of the epoxide at 3050-3030 cm-1 [22]. Infrared spectroscopy was carried out on a sapphire wafer with a grown PEG film and a clean sapphire wafer as a reference.
Changes in the surface hydrophilicity were determined using contact angle measurements. The equilibrium contact angle, 𝜃0, of a sessile water drop on a planar surface is related to the interface surface energies through Young’s equation [23]
where γSL, γLV, and γSV are the interfacial tension between the solid surface and the liquid, liquid and vapor, and solid surface and vapor, respectively. Due to the surface inhomogeneities the contact angle is usually characterised by a spectrum of angles varying from the advancing contact angle, 𝜃A, to the receding contact angle, 𝜃R. The equilibrium contact angle can be calculated from the advancing and receding angle as [23]
where
In the experiments, the advancing angle was obtained by feeding water to the water drop on the substrate surface with a rate of 6 μL/min. Afterwards, the receding angle was obtained by letting the drop evaporate. A camera (Imaging Source) was used to record an image series of the drop shape development. As water was added to the droplet an image of the droplet was taken every second. As the droplet was left to evaporate, an image was recorded every three seconds. The image series were analysed using the ImageJ plug-in DropSnake, which performs contact angle measurements on image series. It should be noted that initially, as the drop was left to evaporate, the contact angle decreased over time, because the contact area to the surface remained unchanged. As the contact area began decreasing the contact angle in this period remained constant and was recorded as the receding angle.
Fouling tests were carried out at Grundfos’ test facilities. Two types of flow tests, dead-end and cross-flow configuration, were conducted in order to investigate the influence of the PEG film on the fouling process and whether it increased the ease of fouling removal.
BSA and lysozyme solutions were used in the dead-end filtration experiments. Six modified and four reference filters were investigated, one half for each protein solution type. An AMICON 8050 cell (Merck Millipore) with a filtration area of 13.4 cm2 was used in the dead-end filtration tests. BSA and lysozyme solutions were prepared by diluting 1 g/L of protein in 10 mM sodium phosphate buffer at pH 7.2. The iso-electric points of BSA and lysozyme are 4.7 and 10.9, respectively [24]. This means that BSA is negatively charged in the sodium phosphate buffer, while lysozyme is positively charged.
Initially, the flux of clean water, Φ, through all the filters was measured by forcing reverse-osmosis cleaned water (RO-water) through the filter by an applied trans-membrane pressure (TMP) of 0.6 Bar. The permeate was collected in a small container located on a scale, where the weight was recorded every 15 seconds. The protein solutions were filtered, using the same TMP as the clean water flux tests, and the permeate weight was logged. Finally the used filters were rinsed with 2×5 ml of RO-water and stored in RO-water. The filters used in BSA filtration were stored for 24 hours and the filters used in lysozyme filtration were stored for 4 hours. After rinsing and storage in RO-water the clean water flux, Φp, was measured again. From the clean water flux measurements the relative flux reduction (RFR) was derived in order to detect changes in the fouling reversibility due to the presence of the PEG layer.
After the dead-end filtration of BSA, the modified and reference filters were rinsed with RO-water and the protein surface concentration was determined using the CBQCA protein quantification kit (C-6667) (Molecular Probes). Staining of BSA on the filters was carried out according to the manual. Briefly, a 40 mM ATTO-TAG CBQCA (3-(4-Carboxybenzoyl)quinoline-2-Carboxaldehyde)) solution in DMSO was prepared along with a 20 mM KCN solution. The KCN solution was applied to the filter surface, followed by the ATTO-TAG CBQCA solution. The filters were left to incubate at room temperature for one hour and then investigated by fluorescent microscopy for protein quantification. The excitation and emission wavelengths were 465 nm and 550 nm, respectively.
Cross-flow filtration experiments were carried out on equipment that allowed for back-flush cleaning, variable cross-flow velocities, and variable TMP. The filtration area in this setup was 28.8 cm2. In this experimental series, model lake-water at pH 8 was used in order to simulate real-life application, where both salts and biological matter are to be filtered. The artificial lake-water contained 39.69 mg/L sodium sulphate, 57.69 mg/L sodium hydrogen carbonate, 124.19 mg/L sodium chloride, 0.11 mg/L kaolite, 50.00 mg/L N8-alignate, 62.50 mg/L BSA, and 10.80 mg/L humic acid [25].
Two modified filters and two reference filters were investigated in the cross-flow filtration tests. As previously, the fluxes of clean water were determined before the filtration experiments. This was performed using the dead-end configuration, meaning that it was carried out with zero cross-flow at TMP = 0.5, 1, 2, 3 and again 0.5 Bar. Next, the fouling experiments were carried out with constant TMP and varying cross-flow. Back-flush steps were added to the procedure to investigate change in fouling reversibility. The 74 minute filtration procedure consisted of three cycles of 24 minutes with 1, 2, 3, and 1 m3/h cross-flow volume flux for 6 minutes each. One minute backflush was performed between each 24 minute cycle. These cross-filtration tests served two purposes: To determine if the PEG film did affect the fouling process during the filtration and to monitor its impact on the fouling reversibility.
3 Results and Discussion
Hyperbranched PEG films were successfully grown on sapphire wafers and membrane filter surfaces by surface-initiated polymerisation of glycidol. The thickness of a PEG film resulting from a single polymerisation run was found to yield a layer of 4–6 nm thickness. In order to increase the infrared signal from the PEG layer on the surface, this particular sample underwent four polymerisation rounds, resulting in a 55 nm PEG film. All other samples prepared for the study were subjected to a single polymerisation round. The increase in polymer growth rate per round of polymerisations corresponds to the findings of Khan and Huck, who reported a linear polymer brush increase for reinitiated polymerisation [18].
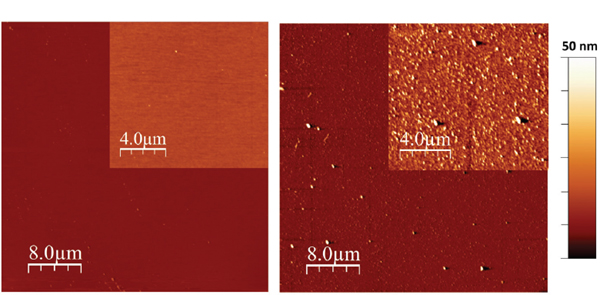
Figure 2 AFM image of a clean sapphire surface (left) and of a PEG film grown on top of a sapphire wafer (right). The inserts in both images have a z-range of 10 nm.
Topography measurements by AFM on a clean and a modified sapphire wafer, respectively, are shown in Figure 2. The AFM image of the clear sapphire wafer did, as expected, showed a very smooth surface with a low number of impurities on the surface. The image of the PEG film on top of a sapphire wafer revealed that the PEG film contained small beads. However, the RMS roughness of the PEG film was measured to be 2.5 nm compared to 0.4 nm for the clean sapphire wafer, meaning that the growth of the PEG film only led to a minor increase in surface roughness.
Figure 3 shows the infrared transmittance spectra of modified and sapphire wafers. It was observed that O-H and C-H bonds were present in the film on the modified sapphire wafer while absent on the reference wafer, indicating successful formation of the PEG film. A cut-off was observed at around 2000 cm-1, which meant that vibrational excitation of the C-O-C group could not be observed. There was no evidence of un-reacted epoxides present in the film. Finally, noise was observed around 3900-3600 cm-1 for both samples. This was most likely due to water vapour in the air interfering with the infrared light beam, since the measurements were carried out in ambient environment.
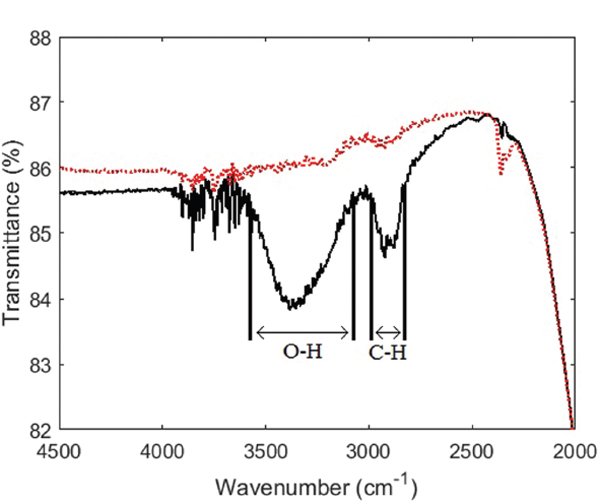
Figure 3 Infrared transmittance spectra of a clean sapphire substrate (red dotted line) and PEG on sapphire (black solid line). The wavenumber ranges corresponding to O-H bonds and C-H bonds, respectively, are highlighted in the plot.
Contact angle analysis was performed on one PEG film grown on a sapphire wafer and one clean sapphire wafer as reference. Images of the process on both samples are shown in Figure 4, where the effect of the PEG film can be clearly observed. It is seen that the surface hydrophilicity of the PEG coated sapphire wafer had increased compared to the reference sample. The receding angle on PEG was difficult to detect, because the droplet barely receded before it was fully evaporated. The results of these experiments are listed in Table 1. It was observed that the equilibrium contact angle was lowered due to the presence of the PEG film, meaning that the surface hydrophilicity had increased on the modified sample compared to the reference sample. It was shown in Figure 2 that the RMS surface roughness only increased slightly due to the growth of the PEG film and the change in contact angle was therefore not ascribed to changes in the surface structure. The change in contact angle was therefore assumed solely to be caused by the presence of the PEG film. The film is also expected to be charge neutral, because excess O-Na+ groups are protonated by water in the end of the polymerisation process.
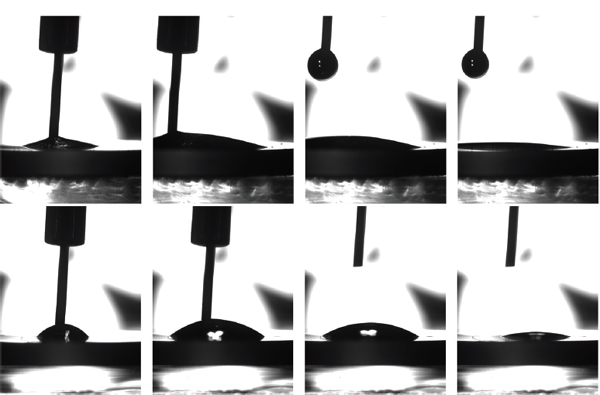
Figure 4 PEG-modified sapphire (top row) and clean sapphire surfaces (bottom row). From left to right: an initial droplet is deposited; droplet volume is increased; needle is retracted and droplet is left for evaporation; droplet is partially evaporated.
Table 1 Advancing, receding, and equilibrium contact angles
| Sample | Advancing Angle | Receding Angle | Young’s Contact Angle |
| PEG | 16.1∘ ± 0.8∘ | 5.1∘ ± 0.4∘ | 11.5∘ |
| Reference | 43.1∘ ± 1.7∘ | 13.0∘ ± 0.7∘ | 28.6∘ |
The decrease in contact angle is due to the high concentration of ether- and alcohol groups in the film. Since only 5 nm PEG film was sufficient to increase the hydrophilicity, the process was transferable to nanoporous membrane filters as it was not expected that it would clog the 200 nm pores.
The normalised and averaged fluxes for the modified and reference filters during filtration of the BSA and lysozyme solutions are shown in Figure 5. The figure shows that during BSA filtration the rate of flux reduction of the modified and reference filters are quite similar. After 250 ml permeated volume the flux through the modified filters, during BSA filtration, was on average reduced by 9%, where the flux through the reference filters was reduced by 11%. Hence, the PEG film showed only moderate effect on the fouling rate during BSA filtration. It was, however, observed that the PEG films on the modified filters had a significant impact on the fouling rate during lysozyme filtration. For the modified filters the flux was on average reduced by 70% after 250 ml permeate, where the same reduction was reached already after 140 ml permeate on the reference filters. In general, the fouling rate was much higher during lysozyme filtration than during BSA filtration.
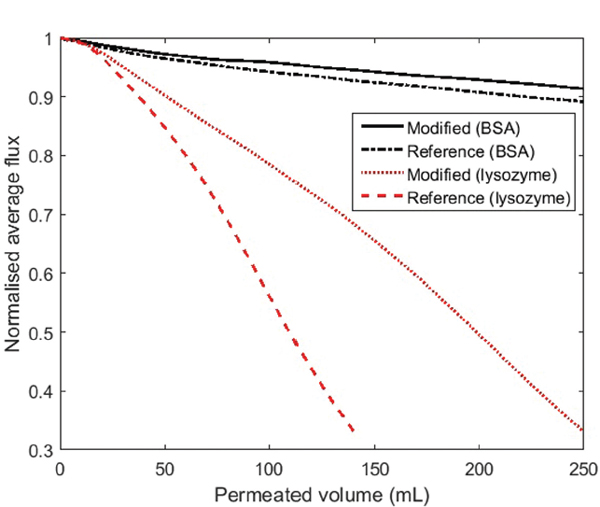
Figure 5 Normalised average flux as a function of permeate volume during BSA and lysozyme filtration through the modified (black solid line and red dotted line, respectively) and reference filters (black dash-dot line and red dashed line, respectively).
For the filters used in BSA filtration, the clean-water flux measurements revealed a lower relative flux reduction (RFR) for the modified filters compared to the reference filters. The modified filters showed an average RFR of 9.5%, whereas the reference filters showed an average RFR of 26.2%. The measurements on the filters used in lysozyme filtration showed no significant difference in RFR, which were 86.0% and 86.7%, respectively.
The above discussed is related to the effect of the PEG layer on the fouling and anti-fouling properties. However, the observed difference between BSA and lysozyme filtrations is caused by electrostatic interactions. BSA fouling, in general, appeared to be predominantly reversible due to the low RFR. Moreover, the presence of the PEG film further increased the reversibility compared to the reference filters. On the other hand, lysozyme fouling seemed to be mostly irreversible, because almost no protein was removed by external cleaning. Thus, as BSA is negatively charged and lysozyme is positively charged at pH 7.2, the results obtained in the dead-end filtration experiments indicate that the filter surface is predominantly negatively charged.
The BSA quantification measurements on modified and reference filters after filtration revealed a higher reversibility of BSA fouling on the modified filter surface. The visualized protein concentration distribution present on the filter surfaces was extracted from the images by pixel-wise intensity analysis and the pixel intensities were calibrated with known protein concentrations. The resulting histograms were generated in ImageJ, and are shown in Figure 6. This analysis revealed that the modified filter had an average protein concentration of 136 μg/cm2 and the reference filter had a concentration of 219 μg/cm2, indicating a significant reduction in the amount of irreversibly adsorbed protein.
The clean water flux tests were performed on modified and reference filters prior to cross-flow filtration of model lake-water. The tests revealed no difference in filter permeability on the modified filters compared to the reference filters. It was therefore concluded that the growth of PEG-brush films on the filter surface does not affect the overall filter performance.
The normalised and averaged fluxes for the modified and reference filters during cross-flow filtration are shown in Figure 7, where it is seen that the PEG film does not seem to have any considerable effect on the permeability behaviour, which seems similar for the two sets of filters. However, the modification of the filter surfaces seems to have an impact on the fouling reversibility. As can be seen in Figure 7 the modified filters recovered a higher percentage of the original permeability after back-flush cleaning. This indicates that the PEG film facilitates removal of foulant compared to the reference samples.

Figure 6 Histogram of protein concentration on modified (red) and reference (black) filter surfaces.
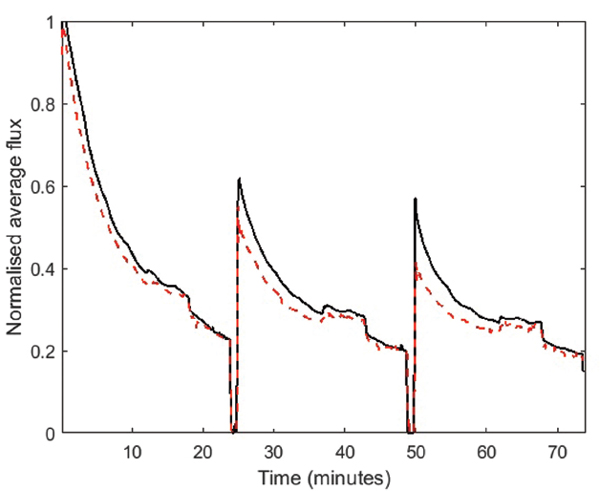
Figure 7 Normalised average fluxes as a function of time during cross-flow filtration of model lake-water through modified filters (black solid line) and reference filters (red dashed line). The arrows mark the times of the backflush sequences.
After the first back-flush cleaning sequence, the modified filters, on average, recovered 64% of the original flux whereas the reference filters recovered only 51%. After the second back-flush sequence the modified filters regained 56%, where the reference filters regained 43%. This is despite the fact that all the filters reached the same flux at the end of each filtration sequence. This increase in flux recoverability also affects the overall throughput in such a filtration sequence, as can be seen in Figure 7. During a full filtration sequence, described in Section 2, the modified filters showed 12% higher average throughput compared to the reference filters.
4 Conclusion
In this work, hyperbranched PEG films were grown on sapphire wafers and sintered alumina membrane filter surfaces by surface initiated, ring-opening polymerisation of glycidol. Initial characterisation of the PEG films was carried out on sapphire wafers. AFM imaging revealed flat topography without significant increase in roughness. The thickness of the film was successfully controlled and kept at a few nanometers, which is required to maintain the permeability of the membrane filters. The presence of an O-H and C-H containing polymer film on a modified sapphire wafer surface was confirmed using transmission infrared spectroscopy and ellipsometry. Finally, contact angle analysis on modified and reference sapphire wafers showed increased hydrophilicity of the modified sample. All in all the polymerisation procedure was verified by ellipsometry, infrared spectroscopy, and contact angle measurements. The resulting film was shown to possess the necessary properties (nanometer thickness and high hydrophilicity) suitable to inhibit the fouling layer on ceramic membrane filters.
The filtration tests on modified and reference filters generally revealed an anti-fouling effect of the obtained PEG-brush film. The dead-end tests showed a lower fouling rate as well as increased reversibility of the modified filters. The protein adsorption quantification showed that the reference filter contained about 50% more irreversibly adsorbed BSA than the modified one. An increased fouling reversibility was also obtained in the cross-flow filtration tests.
This relatively simple and easily up-scalable technique provides the means for lowering the cleaning and replacement frequency of filters and results in lower operation and maintenance costs.
Acknowledgements
The authors would like to thank Grundfos Holding A/S for providing filters and flow test facilities.
References
[1] Naidu, G., Jeong, S., Vigneswaran, S., Hwang, T.-M., Choi, Y.-J., and Kim, S.-H. 2016. A review on fouling of membrane distillation. Desalin. Water Treat. 57: 1–25.
[2] Ho, C.-C., and Zydney, A. L. 2006. Overview of fouling phenomena and modeling approaches for membrane bioreactors. Separat. Sci. Technol. 41: 1231–1251.
[3] Chang, I.-S., Le Clech, P., Jefferson, B., and Judd S. 2002. Membrane fouling in membrane bioreactors for wastewater treatment. J. Environ. Eng. 128-11: 1018–1029.
[4] Saxena, A., Tripathi, B. P., Kumar, M., and Shahi, V. K. 2009. Membrane-based techniques for the separation and purification of proteins: an overview. Adv. Colloid Interface Sci. 145: 1–22.
[5] Yebra, D. M., Kiil, S., and Dam-Johansen, K. 2004. Antifouling technology past, present and future steps towards efficient and environmentally friendly antifouling coatings. Progr. Org. Coat. 50: 75–104.
[6] Jhaveri, J. H., and Murthy, Z. V. P. 2016. A comprehensive review on anti-fouling nanocomposite membranes for pressure driven membrane separation processes. Desalination, 379: 137–154.
[7] Yang, W., Cicek, N., and Ilg, J. 2006. State-of-the-art of membrane bioreactors: Worldwide research and commercial applications in North America. J. Membrane Sci. 270: 201–211.
[8] Geise, G. M., Lee, H.-S., Miller, D. J., Freeman, B. D., McGrath, J. E., and Paul, D. R. 2010. Water purification by membranes: the role of polymer science. J Polymer Sci B Polymer Phys. 48: 1685–1718.
[9] Gironès i Nogué, M., Akbarsyah, I. J., Bolhuis-Versteeg, L. A. M., Lammertink, R. G. H., Wessling, M. 2006. Vibrating polymeric microsieves: antifouling strategies for microfiltration. J. Membrane Sci. 285: 323–333.
[10] Wavhal, D. S., and Fisher, E. R. 2005. Modification of polysulfone ultrafiltration membranes by CO2 plasma treatment. Desalination 172: 189–205.
[11] Ulbricht, M. 2006. Advanced functional polymer membranes. Polymer 47: 2217–2262.
[12] Shen, L., Xie, J., Tao, J., and Zhu, J. 2015. Anti-biofouling surface with sub-20 nm heterogeneous nanopatterns. J. Mater. Chem. B, 3: 1157–1162.
[13] Lih, E., Oh, S. H., Joung, Y. K., Lee, J. H., and Han, D. K. 2015. Polymers for cell/tissue anti-adhesion. Progr. Polymer Sci. 44: 28–61.
[14] Berndt, E., Behnke, S., Dannehl, A., Gajda, A., Wingender, J., and Ulbricht, M. 2010. Functional coatings for anti-biofouling applications by surface segregation of block copolymer additives. Polymer, 51: 5910–5920.
[15] Taniguchi, M., and Belfort, G. 2004. Low protein fouling synthetic membranes by UV-assisted surface grafting modification: varying monomer type. J. Membrane Sci. 231: 147–157.
[16] Chapman, R. G., Ostuni, E., Takayama, S., Holmlin, R. E., Yan, L., and Whitesides, G. M. 2000. Surveying for surfaces that resist the adsorption of proteins. J. Am. Chem. Soc. 122: 8303–8304.
[17] Ostuni, E., Chapman, R. G., Liang, M. N., Meluleni, G. Pier, G., Ingber, D. E., and Whitesides, G. M. 2001. Self-assembled monolayers that resist the adsorption of proteins and the adhesion of bacterial and mammalian cells. Langmuir, 17: 6336–6343.
[18] Kahn, M., and Huck, W. T. S. 2006. Hyperbranched polyglycidol on Si/SiO2 surfaces via surface-initiated polymerization. Macromolecules 128: 5088–5093.
[19] Rahimi, M., Fojan, P., Gurevich, L., and Afshari, A. 2014. Effects of aluminium surface morphology and chemical modification on wettability. Appl. Surface Sci. 296: 124–132.
[20] Horcas, I., Ferñandez, R., Gómez-Rodriguez, J. M., Colchero, J., Gómez-Herrero, J., and Baro, A. M. 2007. WSXM: A software for scanning probe microscopy and a tool for nanotechnology. Rev. Sci. Instruments 78: 013705.
[21] Ford, J. V., Sumpter, B. G., Noid, D. W., and Barnes, M. D. 2009. Refractive index dispersion functions of solid-phase polymers by multicolor optical diffraction. Appl. Phys. Lett. 4: 2515–2517.
[22] Hesse, M., Meier, H., and Zeeh, B. 1984. Spektroskopische methoden in der organischen chemie, Number 3-13-576102-9. Georg Thieme Verlag, Stuttgart.
[23] Tadmor, R. 1984. Line energy and the relation between advancing, receding, and Young contact angles. Langmuir, 20: 7659–7664.
[24] Pfeil, W. 1998. Protein stability and folding, number 3-540-63717-6. Springer, Berlin.
[25] Recipe commonly used at Grundfos’ test facilities.
Biographies

D. A. Nielsen is a research assistant at the Department of Physics and Nanotechnology at Aalborg University in Denmark. He received his Master’s degree in Nanophysics and -materials from the Department of Physics and Nanotechnology at Aalborg University in 2012. He is currently pursuing his Ph.D. about physical and material characterisation of degraded components used in power electronics using microscopy and spectroscopy techniques.

L. Christiansen received his Master’s degree in Nanophysics and -materials from the Department of Physics and Nanotechnology at Aalborg University in 2012. He is currently pursuing his Ph.D., where his work concerns the thermal properties of electrospun polymer materials.

A. H. Holm received his Ph.D. in Chemistry from Aarhus University in Denmark in 2005. From 2005 to 2006 he was a post doc at the University of Padova in Italy and from 2006 to 2008 post doc at Aarhus University.
From 2008 to 2011 he was a development engineer and from 2011 to 2016 senior development engineer, both at Grundfos Holding A/S. He is currently employed as senior materials specialist at Vestas.
K. Dooleweerdt received her Ph.D. in Nanotechnology in 2010. Since 2010 she has been a senior water technology engineer at Grundfos Holding A/S.
P. Fojan received his Ph.D. in Biotechnology at the University of technology Graz, Austria in 1997. He initially worked on industrial genetics of eukaryotic organisms. During his postdoc time at Aalborg University at the Department of Biotechnology he moved into the area of protein physics and molecular modelling. With the startup of Nanotechnology at AAU he moved to the Department of Physics and Nanotechnology where he became an Associate Professor in 2009. His research interests are centered around biological and small molecules and their interactions with cells and surfaces in general, for medical, sensor applications and as antibacterial agents.
L. Gurevich received his Ph.D. in Physics at the Institute of Solid State Physics (Chernogolovka, Russia) in 1994. He initially worked on high-Tc superconductors but during his postdoc stay at Delft University of Technology became excited about nanotechnology and possibility of charge transport through a single molecule. Since 2005 he is an Associate Professor at Aalborg University. His research interests are focused on molecular electronics, biosensors, functional surfaces and nanofabrication.
Journal of Self-Assembly and Molecular Electronics, Vol. 1, 19–38.
doi: 10.13052/jsame2245-4551.2016.002
© 2016 River Publishers. All rights reserved.