An Investigation of the Interaction between Melittin and a Model Lipid Bilayer
Received 4 March 2014; Accepted 27 February 2015; Publication 31 March 2015
Journal of Self-Assembly and Molecular Electronics, Vol. 2, 53–76.
doi: 10.13052/jsame2245-4551.214
© 2015 River Publishers. All rights reserved.
Morten Slyngborg, Esben Skovsen and Peter Fojan*
- Department of Physics and Nanotechnology, Aalborg University, DK 9220 Aalborg Ø, Denmark.
- *Corresponding author: fp@nano.aau.dk
Abstract
The recent emergence of multi-drug resistant bacteria has rendered many common antibiotics ineffective and therefor novel drugs are needed. Antimicrobial peptides have proven applicable in this aspect as they can form self-assembled pore structures in the lipid bilayer of bacterial cells. The exact pore formation is shrouded in controversy and largely unknown as it is difficult to determine empirically. The development of coarse grain force fields in molecular dynamic simulations enables longer timescales and extended simulation systems. This allows for the simulation of lipid bilayer self-assembly and bilayer-antimicrobial peptide interactions. The present work focuses on the antimicrobial peptide, melittin, induced pore formation and is aimed towards determining the mechanism and pore structure.
Keywords
- Antimicrobial peptides
- melittin
- molecular dynamic simulations
- self-assembled melittin/lipid bilayer pore
1 Introduction
The emergence of multi-drug resistant (MDR) bacteria has made treatment of bacterial infections increasingly difficult. The World Health Organization predicts that approximately 35 million humans will die in the years 2000 to 2020, as a result of MDR tuberculosis alone [1]. Furthermore, the Infectious Disease Society of America has estimated that above 70% of all bacteria that cause deadly infections are likely to develop resistance towards at least one common antibiotic [2].
During the last decade, research on antimicrobial peptides (AMPs) has attracted an increasing amount of interest. AMPs are part of the innate immune system inherent to all eucaryotic organisms and are believed to target the lipid bilayer of cells. Consequently bacteria are unable to develop resistance against this class of molecules [3]. It is believed that the antimicrobial activity of most AMPs arise from their ability to form self-assembled pore structures in lipid bilayers, which inevitably leads to the diffusion of cell content out of the organisms [3]. However, probing the self-assembled AMP-lipid bilayer structure is inherently difficult, as it requires sensitive measurements of chemical and structural changes. Therefore the exact mode of action remains controversial. As of today three models are commonly accepted and highly debated: The carpet, toroidal and barrel-stave pore model (Figure 1) [4, 5].
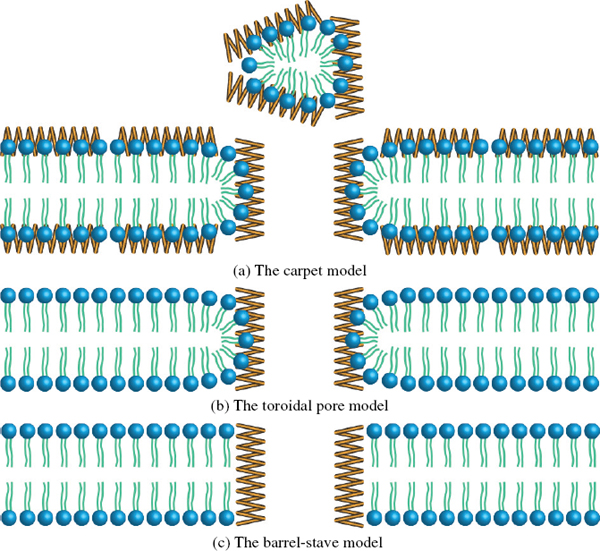
Figure 1 (a) The carpet model where AMPs decompose the bilayer by forming an extensive carpet/layer on the surface, which causes enough tension to disrupt the bilayer. (b) The toroidal pore model where the bilayer is penetrated by the AMPs, which forms a hourglass shaped pore as the bilayer surface adopts a curvature. (c) The barrel-stave model where the bilayer is penetrated by the AMPs forming a pore but the lipids in the membrane retain their orientation of order. Inspired by [4]
Melittin (MLT), which constitutes the main component of the poison from the european honey bee (Apis mellifera), is one of the best studied AMPs as of today [6, 8]. It is a 26 residue long cationic peptide with the sequence [GIGAVLKVLTTGLPALISWIKRKRQQ] [6, 8]. Indications that MLT induces pore formation according to the mechanism of all three models have been reported, but presently support for the toroidal pore model is predominant [9–14]. While in solution MLT is essentially unstructured, but upon binding to a lipid bilayer it adopts an α-helical structure. The α-helix is disrupted in the middle by a proline residue inducing a kink in the helix [6, 7]. The bending angle of the kink has been studied under several conditions. The main results of these studies are listed in Table 1. The bending angles are significant as they indicate how MLT molecules are oriented with regards to the lipid bilayer normal.
Table 1 Overview of selected studies and results of the MLT bending angle induced by the PRO-14 residue in different lipid structures
| Lipid Structure | Bending Angle of the Kink | Reference |
| Lyophilized DTPC bilayer | 130° ± 9° | [8] |
| Dry or hydrated gel phase DTPC bilayer | 142° ± 3° | [8] |
| DPC micelles | 126° ± 15° | [15] |
| Fluid-phase DTPC multilayer | 120° < and close to 160° | [16] |
| PC vesicles | 86° ± 34°) | [17] |
| DLPC bilayer | 126° ± 8° | [18] |
| DPPC bilayer | 119° ± 6° | [18] |
The orientation of MLT relative to the lipid bilayer surface normal has been studied intensively. These studies revealed that the orientation of MLT peptides depends on numerous experimental factors such as the MLT/lipid ratio, bilayer composition, hydration level of the lipid bilayer and phase state of the lipids [7, 19]. Most reports only distinguish between the general orientations, parallel or perpendicular, but in a recent study a distribution function of the MLT orientation in a DPPG bilayer was deduced based on sum frequency generation (SFG) spectroscopy [20]. Two maxima around 6° and 100° with respect to the bilayer surface normal (26.3 % parallel and 73.7% perpendicular oriented) have been identified. Additionally, a stable pseudo-parallel orientation is possible, where one MLT terminal is located in the lipid head group area and the other in the acyl tail area [21].
The minimum number of required peptides to form a stable pore might also give indications of the pore type. A stable toroidal pore requires the least amount of AMPs, whereas the barrel-stave induced pore needs more AMPs to be stable and the carpet model requires the most AMPs to be effective. Based on these observations a minimum of 6-19 MLT molecules are required to induce a transmembrane pore [22], which is supported by experimental results that 6--7 MLT peptides are sufficient to form a barrel-stave pore [9]. Contrary to that it has been suggested that 4 MLT molecules are sufficient [10, 11].
It has also been proposed that the pore size depends on the MLT/lipid ratio [7, 9, 19]. For this reason several pore diameters have been reported and are listed in Table 2.
Table 2 Overview of selected studies and results of the pore diameter induced by MLT molecules
| Pore Diameter | Reference |
| 1.3-2.4 nm | [9] |
| 1.0-6.0 nm | [23] |
| 2.5-3.0 nm | [24] |
For a barrel-stave pore the number of MLT molecules participating in a pore, n, can be estimated by the formula n ≈ π (dp/dM +1), where dp and dM are the pore diameter and the average diameter of the helices of MLT (≈ 1.2nm), respectively [22]. Applying the formula to the smallest pore diameter reported (1nm), assuming a barrel-stave pore, the minimum number of MLT peptides to participate in the pore is ∼ 6. As pores consisting of 4 MLT peptides have been reported earlier, this may be an indication for toroidal pores [10, 11].
Despite all the experiments devoted to determine the self-assembled MLT/lipid pore structure, the true mode of action still remains unknown. Support for either of the three models may be found in literature, but many studies indicate that MLT acts in a detergent like method at high MLT/lipid ratios, whereas pores conforming to the toroidal model are observed at lower ratios [9–14].
Several studies have applied molecular dynamics (MD) simulations to investigate the interaction of MLT and a lipid bilayer. Due to the high complexity of the system, the simulations are often restricted to short time scales that does not allow for the actual self-assembly to be monitored. To overcome this, MLT simulations are often initialized with the MLT peptides embedded into the lipid bilayer, assuming some initial conformation of the pore. An example of this was conducted with four MLT molecules initially embedded in the POPC lipid bilayer and a pore formation process was monitored [22]. In another study a series of MD simulations were conducted were the MLT/lipid bilayer configuration was initially manipulated to match a toroidal or barrel-stave pore [25]. These simulations revealed that the toroidal pores consisting of MLT tetramers remained stable, while the barrel-stave pores were reshaped into toroidal pores. Investigations of the changes in the α-helix kink angle and secondary structure of a single MLT molecule in different environments, water, methanol and in a DMPC lipid bilayer has also been studied with MD simulations [26]. Furthermore, in a series of MD simulations, several spontaneously induced pore formations in DPPC lipid bilayers above a critical MLT/lipid ratio of 1/64 [12] have been observed. The shape of the pores were found to be disordered toroidal pores, as few MLT molecules were oriented parallel to the bilayer surface normal, while the rest were located close to the pore entrance in a perpendicular fashion.
Recent advances in the development of coarse-grained (CG) force fields (MARTINI [27]), have rapidly extended the achievable simulation time for large complex systems. This has been achieved by combining a maximum of four atoms into one pseudo-atom with the united properties of the combined atoms and thereby reducing significantly the number of interactions to be calculated in the simulation [27]. As the force field has been meticulously parameterized for lipids and peptides to fit experimental data, it is well suited for the study of MLT – lipid bilayer interactions from dissolved MLT peptides, to first contact with the lipid bilayer and to the final stable pore.
A restrictions of the MARTINI force field is that the secondary structure of proteins and peptides cannot change during the simulation and some structural details are lost during the coarse grain mapping.
2 Methods
2.1 Simulation Conditions
A MD simulation with 6 MLT molecules was performed using the GROMACS suite of programs (v.4.5.3) [28] and the MARTINI force field (v.2.1) [27]. Periodic boundary conditions (PBC) were applied to a semiisobaric-isothermal ensemble, coupled to a Berendsen temperature bath. The reference pressure and temperature were set to 1 bar and 323 K, respectively. Electrostatic interactions were calculated with the particle mesh Ewald algorithm, with a real space cut-off value of 1.2 nm. The MD simulation was run for 75 ns with 25 f s time-steps.
2.2 Initial Configuration
Starting from the crystal structure of MLT (pdb id: 2MLT) a single MLT molecule was transformed to CG with the awk script atom2cg (v.2.1) [28]. The secondary structure was determined with DSSP [29], which was needed for the script seq2itp.ssd [28] to produce a topology file for MLT.
The initial simulation box had dimensions of 70°A × 70°A × 140°A (x × y × z), as to minimize the effects of long range electrostatic interactions through the PBC in z-direction. The respective number of MLT peptides were then placed at a distance of 1.2 nm from a pre-self-assembled lipid bilayer (located in the center and spanning the xy-plane) consisting of 128 dipalmitoylphosphatidylglycerol (DPPG) molecules. CG polarized water was added at all sterically allowed positions with no restrictions on quantity. Hence, water was also added to parts of the hydrophobic lipid bilayer core, which were removed manually in Pymol [30]. This left 4200 molecules in the system. The ensembles were energy minimized after each modification with a steepest descent algorithm using 100000 steps. However, as it was desired that all MLT peptides would have the same initial orientation, their positions were restrained during the minimization. To ensure a suitable initial simulation structure a short unrestrained minimization of 1000 steps was carried out.
3 Results and Discussion
3.1 Simulation Overview
The present simulation was performed with 6 MLT molecules, which is sufficient to form both a barrel-stave and toroidal pore. Hence we expect that given the simulation conditions both pores are possible. Evidently, the formed pore is a toroidal pore as lipid head groups participate in the shielding of the polar lipid acyl tails from water as is illustrated in the overview of the simulation in Figure 2. However, the model and estimations that 6 MLT molecules are sufficient to form a barrel-stave pore is based on the assumption that all peptides assume a transmembrane orientation, which was not the case in the present simulation. Hence it cannot be ruled out that more MLT molecules would have resulted in a pore resembling a barrel-stave pore. The same phenomena, that some peptides assumed perpendicular orientations to the bilayer surface normal, has been reported in a recent FG simulation. [12]. Which is an indication that simulations do not strictly conform to one model.
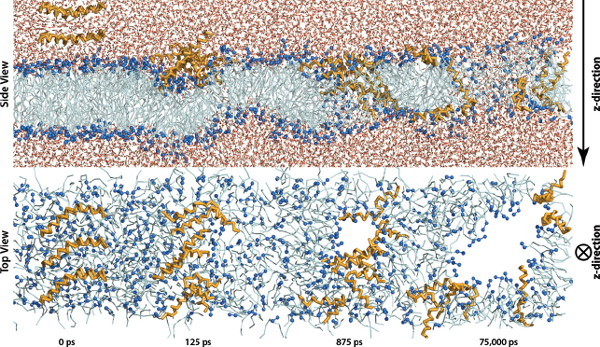
Figure 2 Time evolution of the ensemble with 6 MLT molecules from both a side view and a top view. For simplicity water molecules are not shown in the top view and MLT side chains are transparent. Water molecules are shown as red and white lines, lipid head groups as dark blue beads, lipid acyl tails as light blue and MLT molecules as orange.
The pore was formed very quickly after 875 ps of the simulation. Such a fast interaction is unusual but may in fact be a matter small molecular motions and the strong attractive electrostatic interactions between MLT and the bilayer. As not much simulation time is wasted on random molecular drift this aids in the relevance of this simulation since the simulation time is rather limited.
3.2 Spontaneous Pore Formation
Initial contact between MLT molecules and the lipid bilayer causes stress in the bilayer, which leads to water penetration into the bilayer core (Figure 2). This effect together with a proposed thinning effect of MLT on the lipid bilayer as described for other AMPs including alamethicin, magainin 2 and protegrin [31–33], may be the reason why MLT molecules are able of overcome the energy barrier for a hydrophilic MLT terminus to cross the hydrophobic bilayer core. In cases where MLT adopts a parallel orientation, the N-terminus always migrates through the bilayer core, while the C-terminus only cross the core if the peptide adopts a perpendicular orientation on the bilayer leaflet surface initially furthest away from the MLT molecules (Figure 3). This is to be expected since the N-terminus is quite hydrophobic, while the C-terminus is highly charged. In general another consequence, peptides that are perpendicular oriented have the C-terminus located close to the lipid head group/water interface, while the N-terminus is located closer to the acyl tail area (Figure 3a).
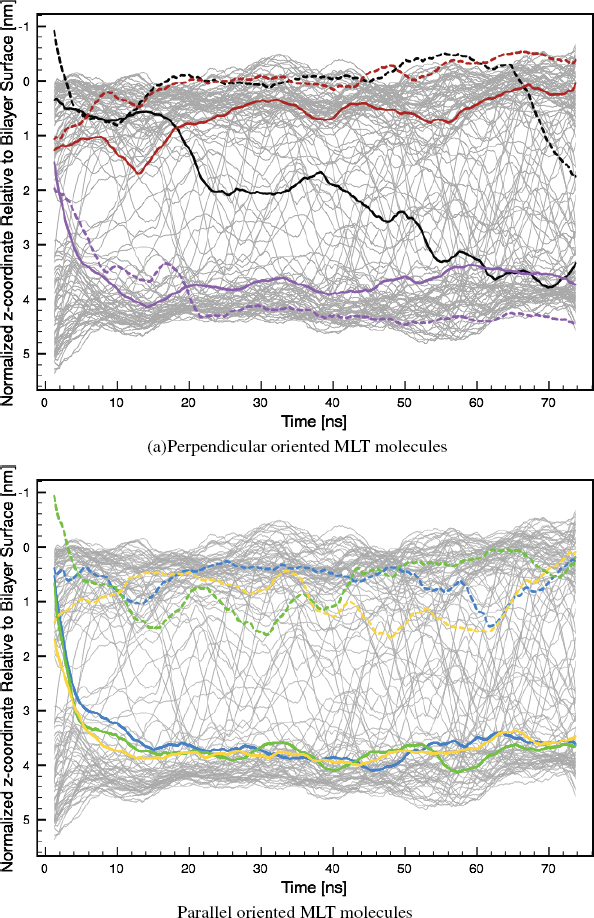
Figure 3 z-trajectory of lipid head groups (gray), N-terminus (solid colored line) and C-terminus (dashed colored line) of MLT normalized to the lipid bilayer surface as a function of time (the z-direction relative to the simulation box is depicted in Figure 2). Black: MLT1, blue: MLT2, green: MLT3, red: MLT4, purple: MLT5 and orange: MLT6.
3.3 MLT Bending Angle
The MLT α-helix bending angles induced by PRO-14 as a function of time were found to fluctuate around three states; 66°±10°, 100°±10° and 140°±20° (Figure 4).

Figure 4 MLT α-helix bending angles induced by PRO-14 as a function of time. Black: MLT1, blue: MLT2, green: MLT3, red: MLT4, purple: MLT5 and orange: MLT6.
A parallel MLT orientation (MLT2, MLT3 and MLT6) with respect to the lipid bilayer surface normal is associated with the 140° ± 20° state. This is in very good agreement with earlier reported values, ranging from 119° ± 6° to 160° for different lipid bilayers. Furthermore, our results are comparable with MD simulations of POPC bilayers (∼ 134° ± 20°) and DMPC bilayers (∼ 134° ± 10°), where both started with an initial structure of four MLT molecules embedded in the respective bilayer [22, 25].
The perpendicular oriented MLT molecules (MLT4 and MLT5) assume 66° ± 10° and 100° ± 10° states. This can intuitively be understood as the parallel oriented peptides needs to be stretched in order to span the thickness of the bilayer, while perpendicular orientated peptides can be in a more relaxed folded state. In a NMR study where MLT had fused with PC vesicles, MLT molecules were orientated perpendicular due to a low peptide concentration. In this case small bending angles of 86° ± 34° were observed, which is consistent with results in the present simulation [17]. Small bending angles for perpendicular oriented MLT molecules have also been observed in other MD simulations as well [34].
MLT1 has a special pseudo-parallel orientation with the C-terminus bound to one leaflet and the N-terminus bound to lipids participating in the pore wall, which has also been observed experimentally [21]. This allows for a rather flexible bending angle which remains stable in either the 66° ± 10° or the 100° ± 10° state.
3.4 MLT Orientation with Respect to the Lipid Bilayer Surface Normal
The orientation of MLT with respect to a lipid bilayer surface normal is usually given by either the principal axis of the peptide helix or from the N-terminus to PRO-14 and from PRO-14 to the C-terminus as two individual segments axis (GLY1-PRO14 and PRO14-GLN26). In the present study both conventions are used in the investigation as they yield different insight.
In the present simulation, both perpendicular and parallel MLT molecules were observed (Figure 5). The tilt of the principal axis of the MLT helix with respect to the lipid bilayer surface normal was calculated as a function of time (Figure 6). MLT4 and MLT5 binds to the bilayer surface in a perpendicular orientation, tilted 79° ± 10° and 106° ± 10°, respectively. They assume a U-shaped configuration with the middle section of the helix slightly buried in the hydrophobic bilayer core (Figure 5), which is similar to what has been observed in a similar MD simulation [34]. MLT2, MLT3 and MLT6 adopts a parallel transmembrane orientation with a tilt of 34° ± 26°. MLT1 is distinguished from the other peptides as it has the special pseudo-parallel orientation.
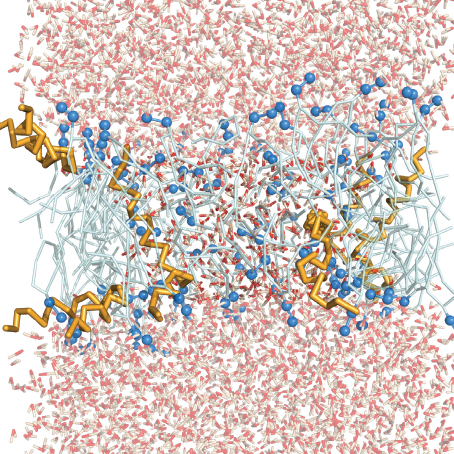
Figure 5 Snapshot of the simulation after 75ns, where a self-assembled MLT/lipid pore has reached an equilibrium. Same color representation applies as in Figure 2, expect water molecules in the bilayer core have been emphasized and lipids have been made transparent for clarity.
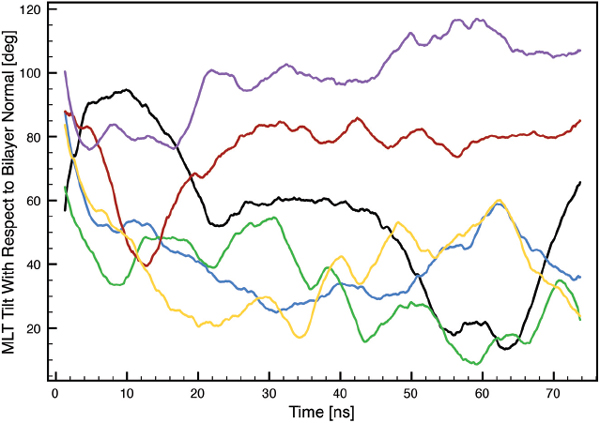
Figure 6 Tilt of the principal MLT helix axis with respect to the lipid bilayer surface normal as a function of time. Black: MLT1, blue: MLT2, green: MLT3, red: MLT4, purple: MLT5 and orange: MLT6.
A tilt shift distribution function of MLT in a DPPG bilayer has been deducted experimentally with SFG spectroscopy, where two local maxima at about 6° and 100° were located [20]. Furthermore, the population of parallel and perpendicular oriented MLT molecules was determined to 26.3% and 73,7%, respectively. This is in consensus with angle of perpendicular oriented MLT molecules found in the present study and MLT5 is very close to the local maximum. However, the transmembrane oriented peptides are slightly more tilted and we have a different orientation distribution than that found in the SFG study [20]. The discrepancy, may be explained, as only one bilayer leaflet was in contact with water in the SFG experiment. This might reduce the incentive for the hydrophilic MLT terminus to cross the polar bilayer core, which is required for MLT to take a parallel orientation. Additionally, the lipids in the opposite bilayer leaflet are restricted in their motion, due to the solid support on which the bilayer is suspended, the MLT peptides might be expected to have difficulty with assuming a parallel orientation. Furthermore, it is know that the MLT/DPPG ratio influences the MLT orientation and that low ratios induce the perpendicular orientation [7, 19]. Since the MLT/DPPG ratio in the this study was very high in comparison to the SFG experiment, it may also explain the higher amount of parallel oriented MLT molecules found in the present simulation.
The orientation of MLT molecules was also investigated by calculating the tilt of the N- and C-terminus α-helix segments as a function of time (Figure 7). The two perpendicular MLT peptides (MLT4 and MLT5) have N- and C-terminus tilting angles in the range of 65° ± 15°. The N- and C-terminus tilting angles of the transmembrane MLT molecules (MLT2, MLT3 and MLT6) are 43° ± 31°. The large tilt fluctuation of the transmembrane MLT molecules, is found to be related to the independent orientation of the terminus α-helix segments, as one segment may be parallel while the other might be perpendicular (Figure 7b). Furthermore, the pseudo-parallel peptide (MLT1) fluctuates between the two orientations, but during most of the simulation time it assumes a perpendicular orientation.
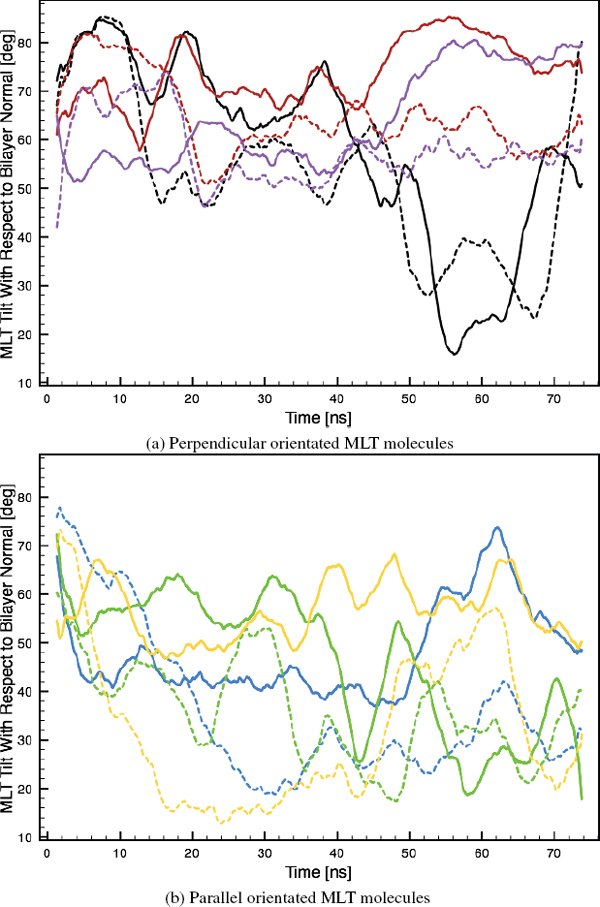
Figure 7 Tilt of the N- (solid colored line) and C-terminus (dashed colored line) helix segments as a function of time. Black: MLT1, blue: MLT2, green: MLT3, red: MLT4, purple: MLT5 and orange: MLT6.
In general, the N-terminal α-helix segments are more tilted with respect to the bilayer surface normal than the C-terminal segments over the 75ns long simulation period. However, this trend is less accentuated with perpendicular or pseudo-parallel oriented MLT molecules, than with parallel oriented MLT molecules (Table 3). This theoretical observation may form the basis for a novel experimental determination of AMP orientations in lipid bilayers.
Table 3 Overview of the individual MLT molecules general orientation and the relative tilting angle of the N- compared with the C-terminus α-helix segment
| Molecule # | General Orientation with Respect to Bilayer Normal | Relative Tilting Angle of N- to C-Terminus α-Helix Segment |
| MLT1 | Pseudo-parallel | 11.1% |
| MLT2 | Parallel | 32.3% |
| MLT3 | Parallel | 29.0% |
| MLT4 | Perpendicular | 13.4% |
| MLT5 | Perpendicular | 10.7% |
| MLT6 | Parallel | 77.5% |
3.5 Pore Size and Cross-section
The self-assembled pores are found to have an elliptical cross-section (Figure 2) with increasing diameters as a function of time (Figure 8). The small and large pore diameter reach equilibrium sizes of ∼ 34.5 °A and ∼ 49 °A, respectively.

Figure 8 Size of the large (black) and small diameter (blue) of the MLT induced elliptical shaped pore as a function of time.
In a FG simulation study of four MLT molecules initially embedded in a POPC bilayer consisting of 200 lipids, an equilibrium pore size of 28-36 °A was reported [22]. This is similar to the present results when considering the differences in bilayer composition and number of MLT molecules.
Compared to experimental data, the size of the stable pore in the present simulation is in the high end of the measured range (10-60 °A). This may be explained by different lipid compositions and the fact that empirical experiments often include ions that may screen the repulsive electrostatic forces driving the pore expansion.
The ratio of large to small pore diameter as a function of time is found to converges towards 1.4 (Figure 9). Interestingly, the equilibrated pore from a FG MD simulation study also adopted an elliptical cross-section and with a simple examination of this illustrated pore structure, we measure a large to small pore diameter ratio of 1.3 [22]. Hence, we believe that a limited amount of peptides participating in a toroidal pore, will segregate into two major clusters. These repel each other due to intermolecular forces, causing an elliptical shaped pore with a constant large to small pore diameter ratio of ∼ 1.4, depending on the lipid properties. If more MLT molecules participate in the pore formation, it is likely that more clusters are formed, leading to a more circular pore cross-section.
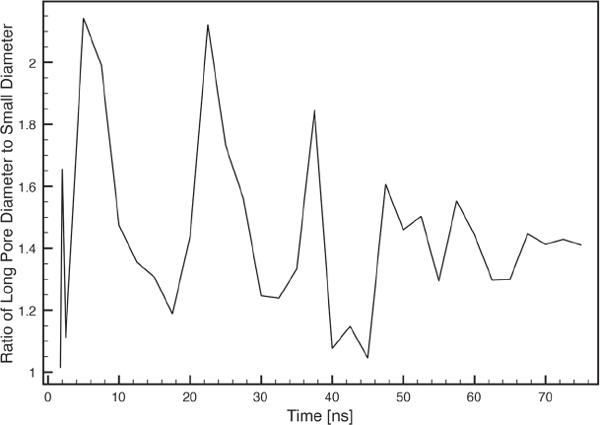
Figure 9 Large to small inner pore diameter ratio as a function of time.
3.6 Water Permeability and Lipid Flip-Flopping
Until the equilibrium pore size has been reached, the permeability of water increases towards a stable number of ∼ 380 CG molecules (Figure 10). This is in good agreement with result obtained in an atomistic MD simulation, where just above 400 water molecules entered a somewhat smaller pore [22]. However, as one CG water molecule in the MARTINI model corresponds to 4 FG water molecules there is a large discrepancy, which cannot be explained by lipid composition or the difference in size of the pore. Instead we believe it caused by the lack of a common convention to define the pore boundaries. In the present work, the two planes of the interfaces between the normal planar bilayer and water have been used as boundaries and all water molecules within this area were counted as inside the pore.
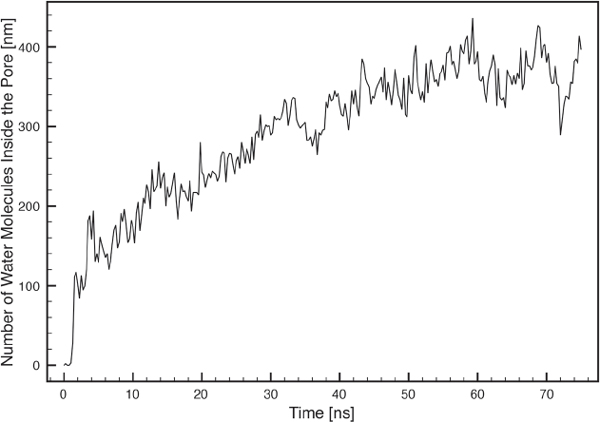
Figure 10 Number of water molecules inside the pore as a function of time. The pore was considered to have a height of 25 °A.
As the pore size increases, the possibility for the MLT molecules to shield the lipid acyl tails from water diminishes. This is a possible explanation why lipid head groups participate in the pore wall in a coordinated fashion where they also flip-flop (Figure 3). In addition to supporting the pore wall, the lipid flip-flopping may also be an attempt to equalize the charge of the two bilayer leaflets, as MLT does not have the same net charge in each terminus. An indication of this, may be found in the nature of the flip-flopping as lipid head groups usually stay within the bilayer core for a short period of time before migrating to the opposite leaflet from where it originally came from. This could be interpreted as if the lipid position inside the pore was a intermediate configuration in order to facilitate a switch between bilayer leaflets.
3.7 Disordered Toroidal Pore
As the lipids reoriente to shield the hydrophobic acyl tails from water in the self-assembled pore, the bilayer attain a positive curvature (Figure 11). This is the classical hourglass shape corresponding to a toroidal pore. However, the pore is somewhat disordered compared to the ideal model as some MLT molecules are in a perpendicular orientation and the rest assists in the shielding of the lipid acyl tails from water exposure.
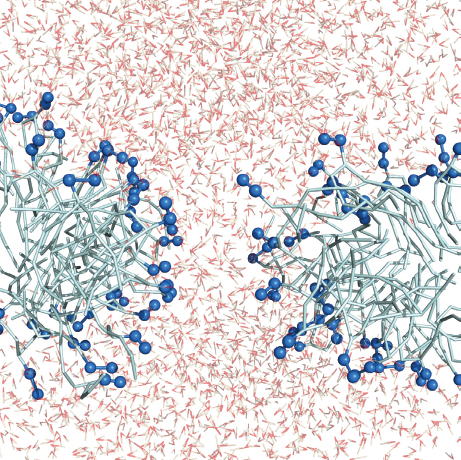
Figure 11 Cross-section of the lipid bilayer after 75 ns along the large diameter. MLT and some lipid molecules have been made transparent for clarity. Same color representation as Figure 2.
The same phenomenon was observed in a FG MD simulation, where only a few MLT molecules had a transmembrane orientation, while the rest aligned perpendicular along the entrance to the pore [12]. However, this is in contrast to the reported results from a CG MD simulation with the MARTINI force field using DPPC bilayers [34]. When MLT molecules were placed on both bilayer sides, very disordered pores were formed consisting only of U-shaped MLT molecules with the middle section pointing into the bilayer core. When MLT molecules where placed only on one leaflet they only observed micellization of the bilayer. Both observations may be described by the fact that the incitement for pore formation was diminished by neutralizing the transmembrane potential with ions, hence leaving only hydrophobic/hydrophilic interactions as the driving-force.
Another inconsistency of the stable pore in the present study compared to the classical toroidal pore model is that lipid head groups tend to be vacant in areas where transmembrane molecules participate in the pore wall, which is a barrel-stave model trait. For this reason the simulated pore conforms mainly to the toroidal pore but with traits from all three models.
4 Conclusion
AMPs have proven to be a possible solution towards treating MDR baceria and other diseases, with several novel drugs emerging [36]. However, it is difficult empirically to acquire structural information on the mechanism of self-assembled pores induced by AMPs, hence challenges remain in designing and controlling the AMP specificity to target pathogens. As to demonstrate the value of computer simulations in this field, the interaction of 6 MLT molecules with a fully hydrated DPPG bilayer was examined in a CG MD simulation. A novel approach was applied where MLT molecules were initially placed in the water phase just away from the short range interaction of the bilayer which allows for several observations that provided new insight regarding the pore formation mechanism of AMPs in a lipid bilayer.
Pore formation was induced at a MLT/DPPG ratio of 6/128 which is within the range where pore formation occurs experimentally. The speed with which the pore assembled aided in reaching a equilibrated stable pore within the limited simulation time of 75 ns.
First contact between the MLT molecules and the bilayer caused sufficient stress for water to penetrate the bilayer. Besides electrostatic interactions, this may be a driving force for the pore formation as the terminus of some MLT molecules migrated to the other bilayer leaflet and adapted a transmembrane orientation. Other MLT molecules migrated to the opposite leaflet altogether but in all cases the least hydrophobic MLT terminus (N-terminus) was the first or only to migrate through the hydrophobic bilayer core.
In general, it was found that three MLT molecules were transmembrane oriented with respect to the bilayer surface normal, while two were parallel and the last had a special pseudo-parallel orientation, as was first empirically observed by Raghuraman and Chattopadhyay [21]. By investigating the orientation of the two helix segments separately, it was observed that over time the N-terminus helix segments were more tilted than the C-terminus helix segments. This tendency was much more pronounced with parallel than with perpendicular or pseudo-parallel oriented molecules. While few results have been reported on the tilting angle of perpendicular oriented MLT molecules, NMR results of parallel MLT molecules indicate that the N-terminus helix segment is more tilted than the C-terminus helix segment in DPPC and DMPC vesicles [18, 35].
The self-assembled pore was found to increase in diameter over time. As this expansion was driven by the repulsion of two MLT clusters the cross-section of the pore became elliptical and reached an equilibrium large and small diameter of ∼ 34.5 °A and ∼ 49 °A which is within the range of the empirically reported pore sizes [9, 23, 24]. The large to small diameter ratio was found to be rather stable over time at a ratio of 1.4, which is remarkably close to what was found in another MD simulated pore in a DPPC bilayer forming a pore with the ratio of 1.3 [22]. Therefore, we propose that when a limited amount of MLT molecules participate in a self-assembled pore, the cross-section becomes elliptical with a constant large to small diameter ratio.
During the simulation, some of the lipids reorient, giving the membrane a positive curvature to shield the hydrophobic lipid acyl tails from the water in the membrane core. This conforms with the toroidal pore model as the membrane remains intact and the curvature obtains an hour-glass shape. However, two discrepancies were observed as not all peptides were parallel oriented, a carpet model trait, and the lipid head groups were vacant in areas where transmembrane MLT molecules were present, a barrel-stave model trait. Hence, the simulated pore is a stable but disordered toroidal pore with features from both the carpet and barrel-stave model. For this reason we cannot rule out that a distinct carpet or barrel-stave model behavior could occur at higher MLT concentrations.
One disadvantage of CG MD simulations is that proteins are unable to change secondary structure, which limits its use in aspects where this is important for the mechanism under study. For MLT, the secondary structure of the tetramer in aqueous solution has been solved to atomic resolution, which was suitable for our simulations as MLT is known to have a very similar structure when in contact with lipids [7].
What becomes evident from the present simulation, is that MLT does not strictly follow one of the AMP-bilayer interaction models, but is acting according to a hybrid model between the toroidal, barrel-stave and carpet model depending on the ratio of AMPs to lipids.
References
[1] D. Shingadia and V. Novelli. Diagnosis and treatment of tuberculosis in children. Lancet Infect Dis, 3: 624-632 (2003).
[2] M. Hassan, M. Kjos, I.F. Nes, D.B. Diep and F. Lotfipour. Natural antimicrobial peptides from bacteria: characteristics and potential applications to fight against antibiotic resistance. Journal of Applied Microbiology, 113: 723-736 (2012).
[3] H. G. Boman. Antibacterial peptides: basic facts and emerging concepts. Journal of Internal Medicine, 254(3): 197-215 (2003).
[4] Kim A. Brogden Antimicrobial peptides: pore formers or metabolic inhibitors in bacteria? Nature Reviews Microbiology, 3: 238-250 (2005).
[5] MR. Yeaman and NY. Yount Mechanisms of antimicrobial peptide action and resistance. Pharmacological Reviews, 55(1): 27-55 (2003).
[6] Kristopher Hall, Tzong-Hsien Lee and Marie-Isabel Aguilar The role of electrostatic interactions in the membrane binding of melittin. Journal of Molecular Recognition, 24(1): 108-18 (2011).
[7] H. Raghuraman and Amitabha Chattopadhyay. Melittin: a Membrane-active Peptide with Diverse Functions. Biosience Reports, 27:189-223 (2007).
[8] Y. -H. Lam, S. R. Wassall, C. J. Morton, R. Smith and F. Separovic. Solid-State NMR Structure Determination of Melittin in a Lipid Environment. Biophysical Journal, 81: 2752-2761 (2001).
[9] Katsumi Matsuzaki, Shuji Yoneyama, and Koichiro Miyajima. Pore Formation and Translocation of Melittin. Biophysical Journal, 73: 831-838 (1997).
[10] M. T. Tosteson and D. C. Tosteson. The sting. Melittin forms channels in lipid bilayers. Biophysical Journal, 36: 109-116 (1981).
[11] H. Vogel and F. Jähnig. The structure of melittin in membranes. Biophysical Journal, 50: 573-582 (1986).
[12] Durba Sengupta, Hari Leontiadou, Alan E. Mark and Siewert-Jan Marrink. Toroidal pores formed by antimicrobial peptides show significant disorder. Biochimica et Biophysica Acta, 1778: 2308-2317 (2008).
[13] Michal Sharon, Ziv Oren, Yechiel Shai, and Jacob Anglister. 2D-NMR and ATR-FTIR Study of the Structure of a Cell-Selective Diastereomer of Melittin and Its Orientation in Phospholipids. Biochemistry, 38: 15305-15316 (1999).
[14] Ziv Oren and Yechiel Shai. Mode of action of linear amphipathic a-helical antimicrobial peptides. Peptide Science, 47: 451-463 (1998).
[15] F. Inagaki, K. Shimada, K. Kawaguchi, M. Hirano, I. Terasawa, T. Ikura and N. Go. Structure of melittin bound to perdeuterated dodecylphosphocholine micelles as studied by two-dimensional NMR and distance geometry calculations. Biochemistry, 28: 5985-5991 (1989).
[16] R. Smith, F. Separovic, T. J. Milne, A. Whittaker, F. M. Bennett, B. A. Cornell and A. Makriyannis. Structure and orientation of the pore-forming peptide, melittin, in lipid bilayers. Journal of molecular biology, 241: 456-466 (1994).
[17] Akihiko Okada, Kaori Wakamatsu, Tatsuo Miyazawa and Tsutomu Higashijima. Vesicle-Bound Conformation of Melittin: Transferred Nuclear Overhauser Enhancement Analysis in the Presence of Perdeuterated Phosphatidylcholine Vesicles. Biochemistry, 33: 9438-9446 (1994).
[18] Shuichi Toraya, Katsuyuki Nishimura, and Akira Naito. Dynamic Structure of Vesicle-Bound Melittin in a Variety of Lipid Chain Lengths by Solid-State NMR. Biophysical Journal, 87: 3323-3335 (2004).
[19] Geert van den Bogaart, Jacek T. Mika, Victor Krasnikov and Bert Poolman. The Lipid Dependence of Melittin Action Investigated by Dual-Color Fluorescence Burst Analysis. Biophysical Journal, 93(1): 154-163 (2007).
[20] Xiaoyun Chen, Jie Wang, Andrew P. Boughton, Cornelius B. Kristalyn, and Zhan Chen. Multiple Orientation of Melittin inside a Single Lipid Bilayer Determined by Combined Vibrational Spectroscopic Studies. J. Am. Chem. Soc., 129: 1420-1427 (2007).
[21] H. Raghuraman and Amitabha Chattopadhyay. Orientation and Dynamics of Melittin in Membranes of Varying Composition Utilizing NBD Fluorescence. Biophysical Journal, 92: 1271-1283 (2007).
[22] Jung-Hsin Lin and A. Baumgaertner. Stability of a Melittin Pore in a Lipid Bilayer: A Molecular Dynamics Study. Biophysical Journal, 78: 1714-1724 (2000).
[23] S. Rex. Pore formation induced by the peptide melittin in different lipid vesicle membranes. Biophysical Chemistry, 58: 75-85 (1996).
[24] A. S. Ladokhin, M. E. Selsted, and S. H. White. Sizing membrane pores in lipid vesicles by leakage of co-encapsulated markers: pore formation by melittin. Biophysical Journal, 72: 1762-1766 (1997).
[25] Maja Mihajlovic and Themis Lazaridis. Antimicrobial Peptides in Toroidal and Cylindrical Pores. Biochim Biophys Acta., 1798(8): 1485-1493 (2010).
[26] Alice Glättli, Indira Chandrasekhar and Wilfred F. van. Gunsteren. A molecular dynamics study of the bee venom melittin in aqueous solution, in methanol, and inserted in a phospholipid bilayer. Eur Biophys Journal, 135: 255-267 (2006).
[27] Siewert J. Marrink, H. Jelger Risselada, Serge Yefimov, D. Peter Tieleman and Alex H. de Vries. The MARTINI Force Field: Coarse Grained Model for Biomolecular Simulations. J. Phys. Chem. B, 111: 7812-7824 (2007).
[28] http://www.gromacs.org/
[29] Wolfgang Kabsch and Chris Sander. Dictionary of protein secondary structure: pattern recognition of hydrogen-bonded and geometrical features. Nucleic Acids Research, 22: 2577-2637 (1983).
[30] http://www.pymol.org/
[31] Y. Wu, K. He, S. J. Ludtke and H. W. Huang. X-ray diffraction study of lipid bilayer membrane interacting with amphiphilic helical peptides: diphytanoyl phosphatidylcholine with alamethicin at low concentrations. Biophys. Journal, 68: 2361-2369 (1995).
[32] S. Ludtke, K. He, and H. W. Huang. Membrane thinning caused by magainin 2. Biochemistry, 34: 16764-16769 (1995).
[33] W. T. Heller, A. J. Waring, R. I. Lehrer, T. A. Harroun, T. M. Weiss, L. Yang and H. W. Huang. Membrane thinning effect of the b-sheet antimicrobial protegrin. Biochemistry, 39: 139-145 (2000).
[34] A. Naito, T. Nagao, K. Norisada, T. Mizuno, S. Tuzi and H. Saitô. Difference between Magainin-2 and Melittin Assemblies in Phosphatidylcholine Bilayers: Results from Coarse-Grained Simulations. The Journal of Physical Chemistry B, 116, 3021-3030 (2012).
[35] Kolattukudy P. Santo and Max L. Berkowitz. Conformation and dynamics of melittin bound to magnetically oriented lipid bilayers by solid-state 31P- and 13C-NMR spectroscopy. Biophys. Journal, 78: 24052417 (2000).
[36] M. Zasloff. Antimicrobial peptides of multicellular organisms. Nature, 415, 389-395 (2002).
Biographies

M. Slyngborg received his Master's degree in Nanotechnology from the Department of Physics and Nanotechnology at Aalborg University, Denmark in 2011. Presently, Morten works as a PhD student at the Department of Physics and Nanotechnology at Aalborg University. His research is focused on sensors based on chiral nanostructures for detection of biomolecules.

E. Skovsen received his Master's degree in Physics from the Department of Physics and Astronomy at Aarhus University, Denmark in 2002. He also received his Ph.D. degree at Aarhus University in 2005, but at the Department of Chemistry. He has been working with ultrafast optics and spectroscopy since 2000 and is currently employed as an Associate Professor at the Department of Physics and Nanotechnology at Aalborg University in Denmark. His current research activities focus on time-resolved and non-linear spectroscopy of nanostructured materials, surface plasmon polaritons and electrospinning.

P. Fojan received his Ph.D. in Biotechnology at the University of technology Graz, Austria in 1997. He initially worked on industrial genetics of eukaryotic organisms. During his postdoc time at Aalborg University at the Department of Biotechnology he moved into the area of protein physics and molecular modelling. With the startup of the Nanotechnology education at AAU he moved to the Department of Physics and Nanotechnology where he became an Associate Professor in 2009. His research interests are centered around biological and small molecules and their interactions with cells and surfaces in general, for medical, sensor applications and as antibacterial agents.